

The price of Solana has undergone a significant correction in recent weeks, from around $210 to around $116. But now there is upside potential.
After proactively alerting Solana to a significant correction when the price was around $190, the price actually fell by about 39%. As a result, Solana reached its correction target of around $130.
Solana Rough Patch: 43.3% price reduction
The correction in SOL prices has been relatively modest so far, with prices down more than 43% this month.
As a result, the histogram of the moving average convergence/divergence (MACD) has also started to trend lower in a bearish direction this month. However, the MACD line is maintaining a bullish crossover on the monthly chart and the Relative Strength Index (RSI) is gradually shifting into neutral territory.
In summary, the bullish upward trend will continue as long as Solana maintains support above the golden ratio level of around $85.
Read more: 6 Best Platforms to Buy Solana (SOL) in 2024
Will Solana hold more than $130? Golden Ratio Support Impact Analysis
Significant Fibonacci support lies within the $125-$130 range for SOL price. Holding above this range could indicate strong bullish sentiment.
Alternatively, the 50-week EMA around $85 would imply further support levels. Weekly chart indicators indicate a bearish outlook, with the MACD histogram trending downward and the MACD line approaching a bearish crossover.
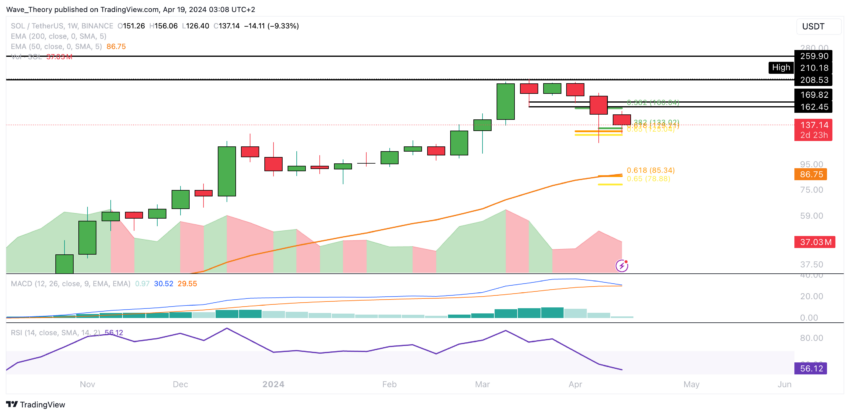
Meanwhile, RSI remains in the neutral zone.
Solana Forecast: Key Fibonacci Resistance Levels to Watch
If Solana bounces off the golden ratio support near $125, it could face significant resistance at the 50-day EMA near $156.6. Horizontal resistance exists between $162.5 and $170, but a break above the golden ratio of $175 is needed to stop the corrective move.
Indicators give mixed signals. The MACD histogram shows a bullish momentum for 3 days and the EMA has a golden crossover, indicating a bullish trend in the short to medium term. However, RSI remains neutral and the MACD line is currently crossing bearishly.
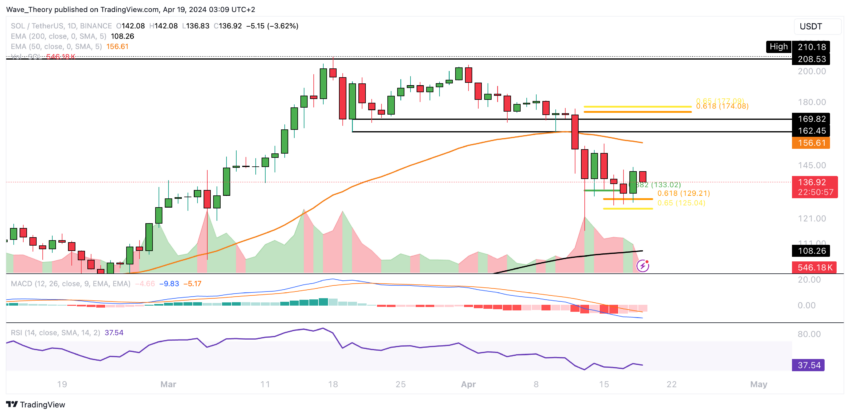
If the current Fibonacci support falters, Solana could potentially find support at the 200-day EMA near $108 before a correction to the golden ratio around $85.
Bearish Pattern: Death Cross Appears on Solana 4-Hour Chart
A short-term bearish trend was recently confirmed by the formation of a dead cross on Solana’s 4-hours chart, indicating a potential downward move towards the golden ratio support between $125 and $130.
Nonetheless, the MACD line remains bullish and the RSI remains in the neutral zone.
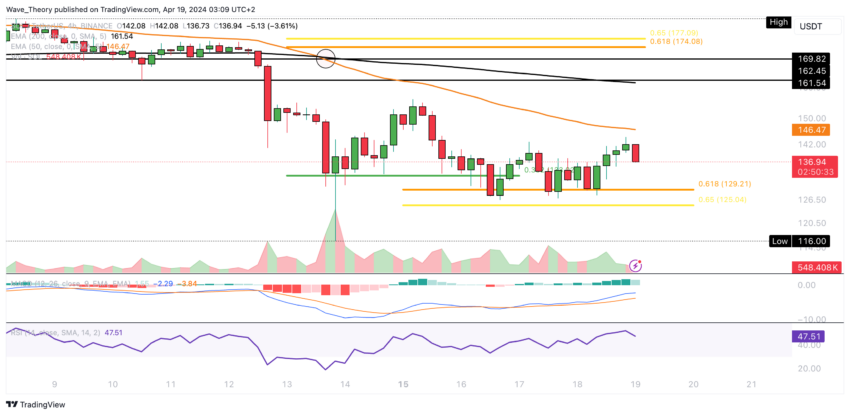
However, the MACD histogram is starting to show bearish momentum with downward ticks.
Solana vs Bitcoin: Solana Hits Crucial Fibonacci Support Level
Compared to Bitcoin, Solana is currently showing Fibonacci support levels between approximately 0.0021 BTC and 0.0023 BTC. This presents a potential opportunity for a bullish bounce.
Read More: Solana (SOL) Price Prediction for 2024/2025/2030
However, it is worth noting that Solana has experienced a downward trend over the past five weeks after experiencing a bearish rejection at the golden ratio resistance of around 0.003 BTC.
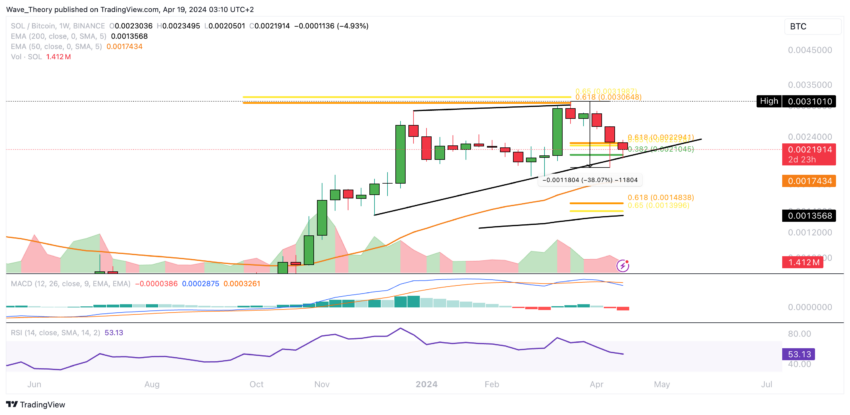
The MACD line has crossed bearishly with a downtrend on the MACD histogram and RSI remains in the neutral zone.
disclaimer
In accordance with Trust Project guidelines, this price analysis article is provided for informational purposes only and should not be considered financial or investment advice. BeInCrypto is committed to accurate and unbiased reporting, but market conditions may change without notice. Always do your own research and consult with a professional before making any financial decisions. Our Terms of Use, Privacy Policy and Disclaimer have been updated.