- WIF has seen prices fall amid a rebound in the general market.
- Key indicators suggest prices may fall further.
Dog-themed meme coin dogwifhat (WIF) did not see a significant price increase last week despite an overall market rally during the period.
According to CoinMarketCap, WIF was trading at $2.84 at press time and is down 2% over the past seven days. This makes it the only major meme asset not to record a price increase last week.
greater losses ahead
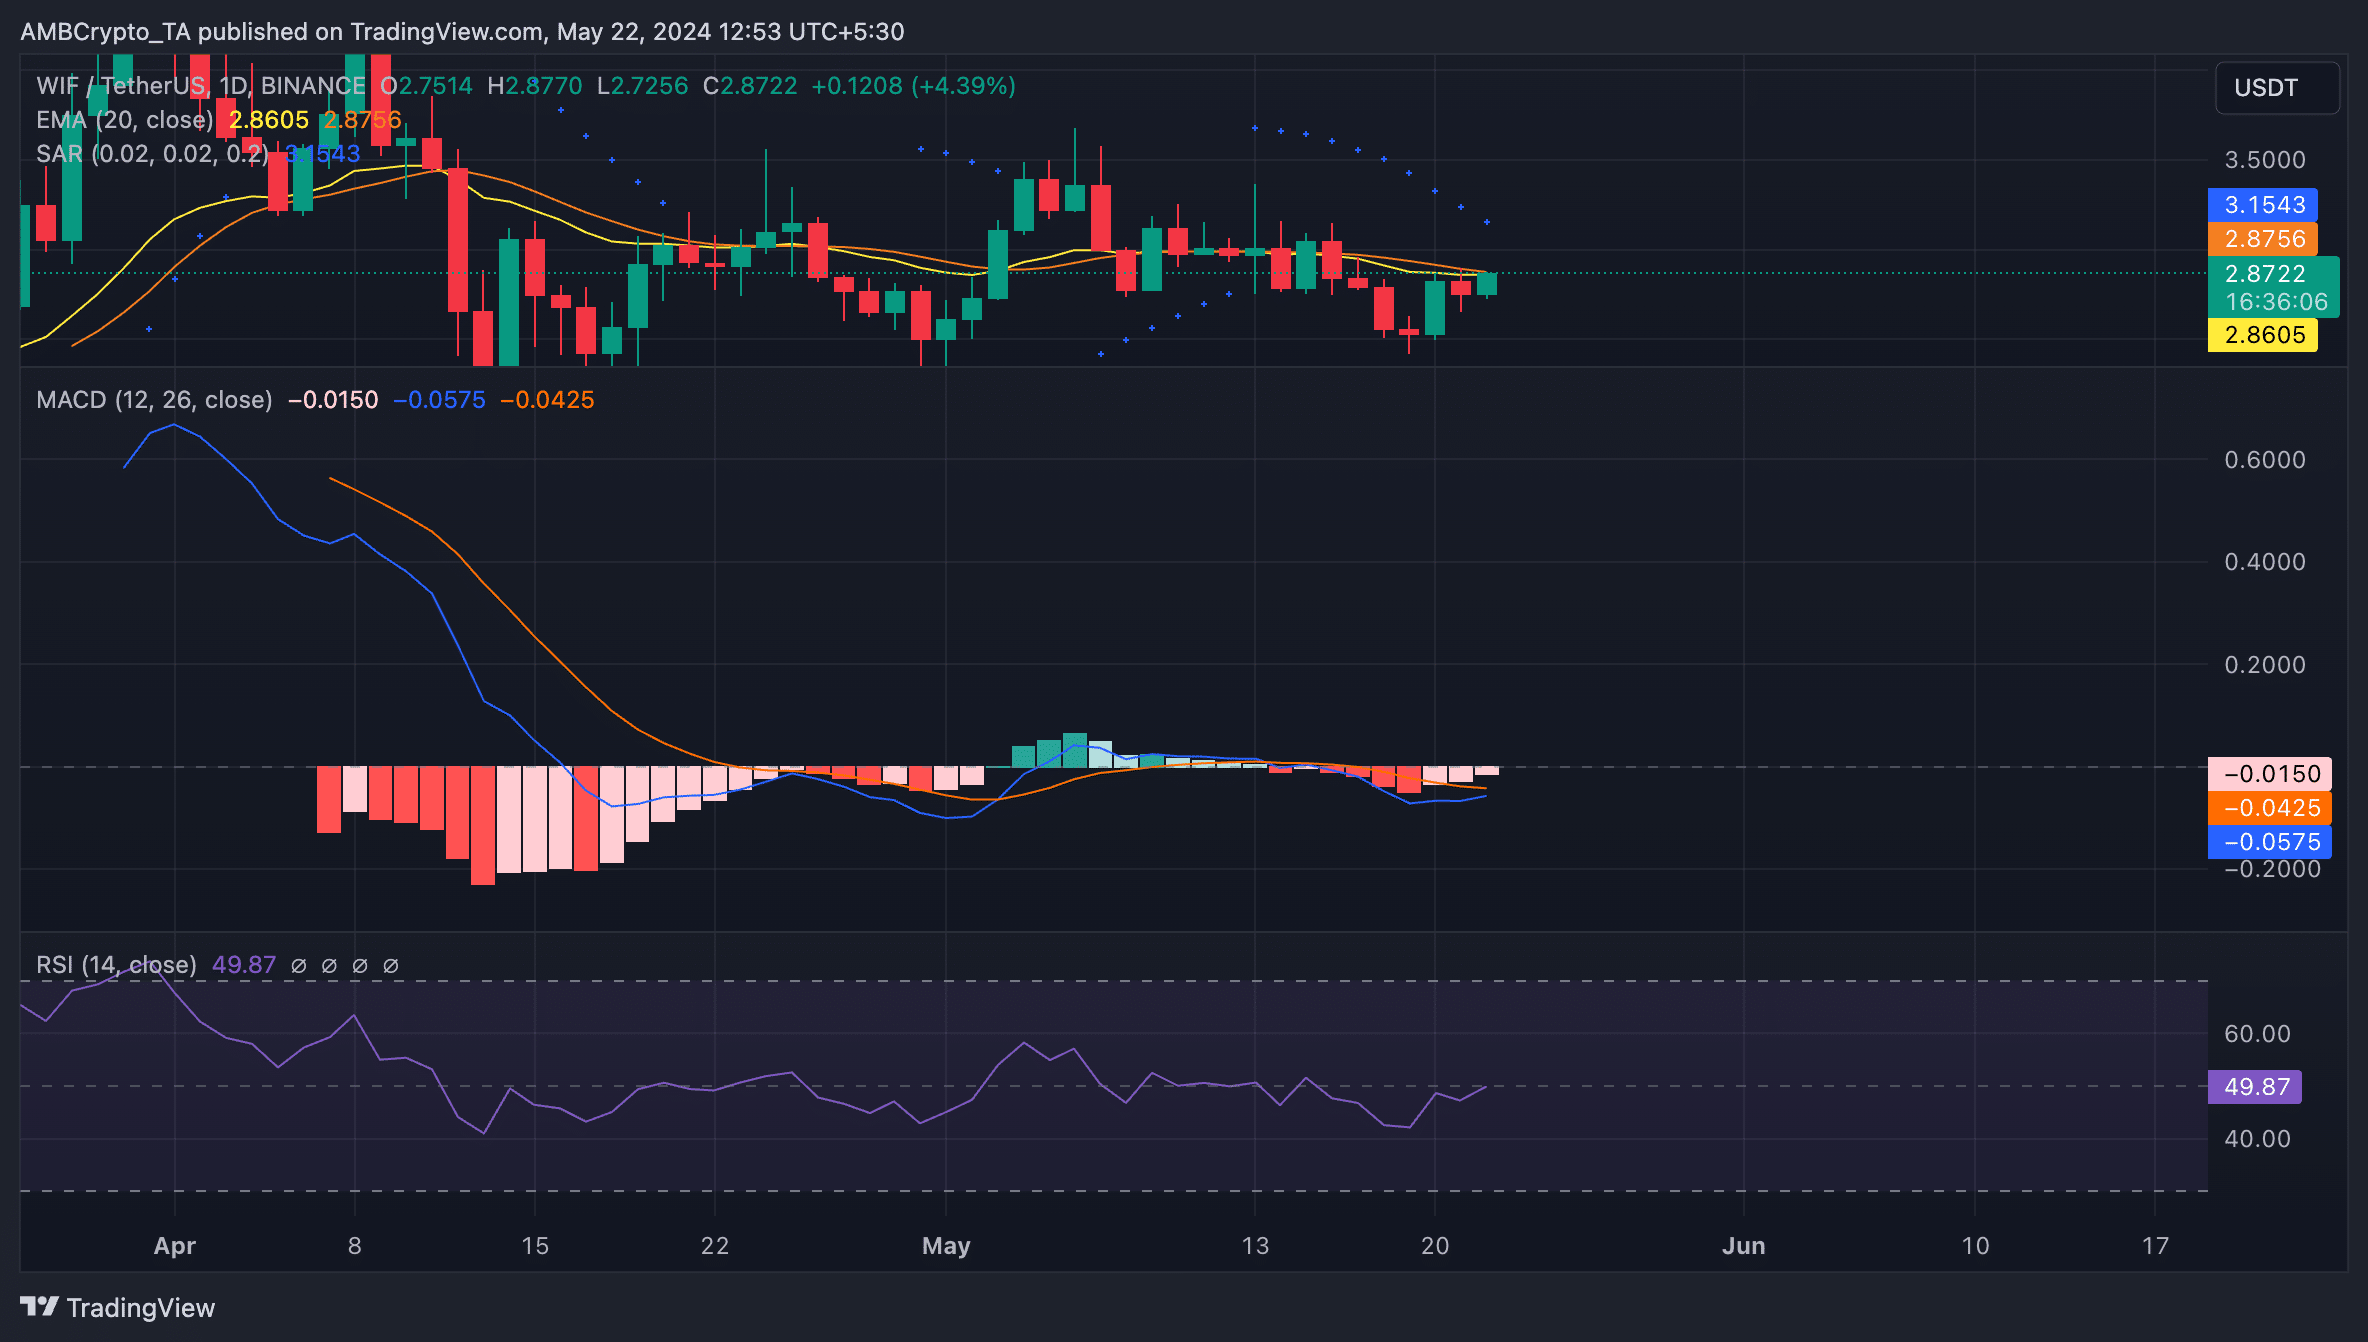
As assessed on the daily chart, WIF’s key technical indicators hinted at the possibility of a continued price decline. First, the meme asset is trading below its 20-day exponential moving average (EMA) at press time.
When an asset is trading below the 20-day EMA, it is considered a bearish signal as it means the current price has fallen below the average price over the past 20 days. Market participants interpret this as a shift to selling coins.
The decline in demand for WIF among market participants is explained by the Relative Strength Index (RSI), which at the time of writing was below the neutral point of 49.47. This value shows that WIF traders prefer selling tokens over accumulating.
Additionally, WIF’s MACD line (blue) lies below the signal line (orange) and the 0 line.
When these lines are set in this way, the asset’s short-term moving average is lower than its long-term moving average. This is a bearish signal that confirms the ongoing downward trend.
Confirming the bearish trend, WIF’s Parabolic SAR dot appeared above the price. It’s been around since May 13th.
This indicator is used to identify potential trend directions and reversals. When the dotted line is above the asset price, the market is said to be in a downward trend.
This indicates that asset prices are falling and the decline may continue.

Source: WIF/USDT on TradingView
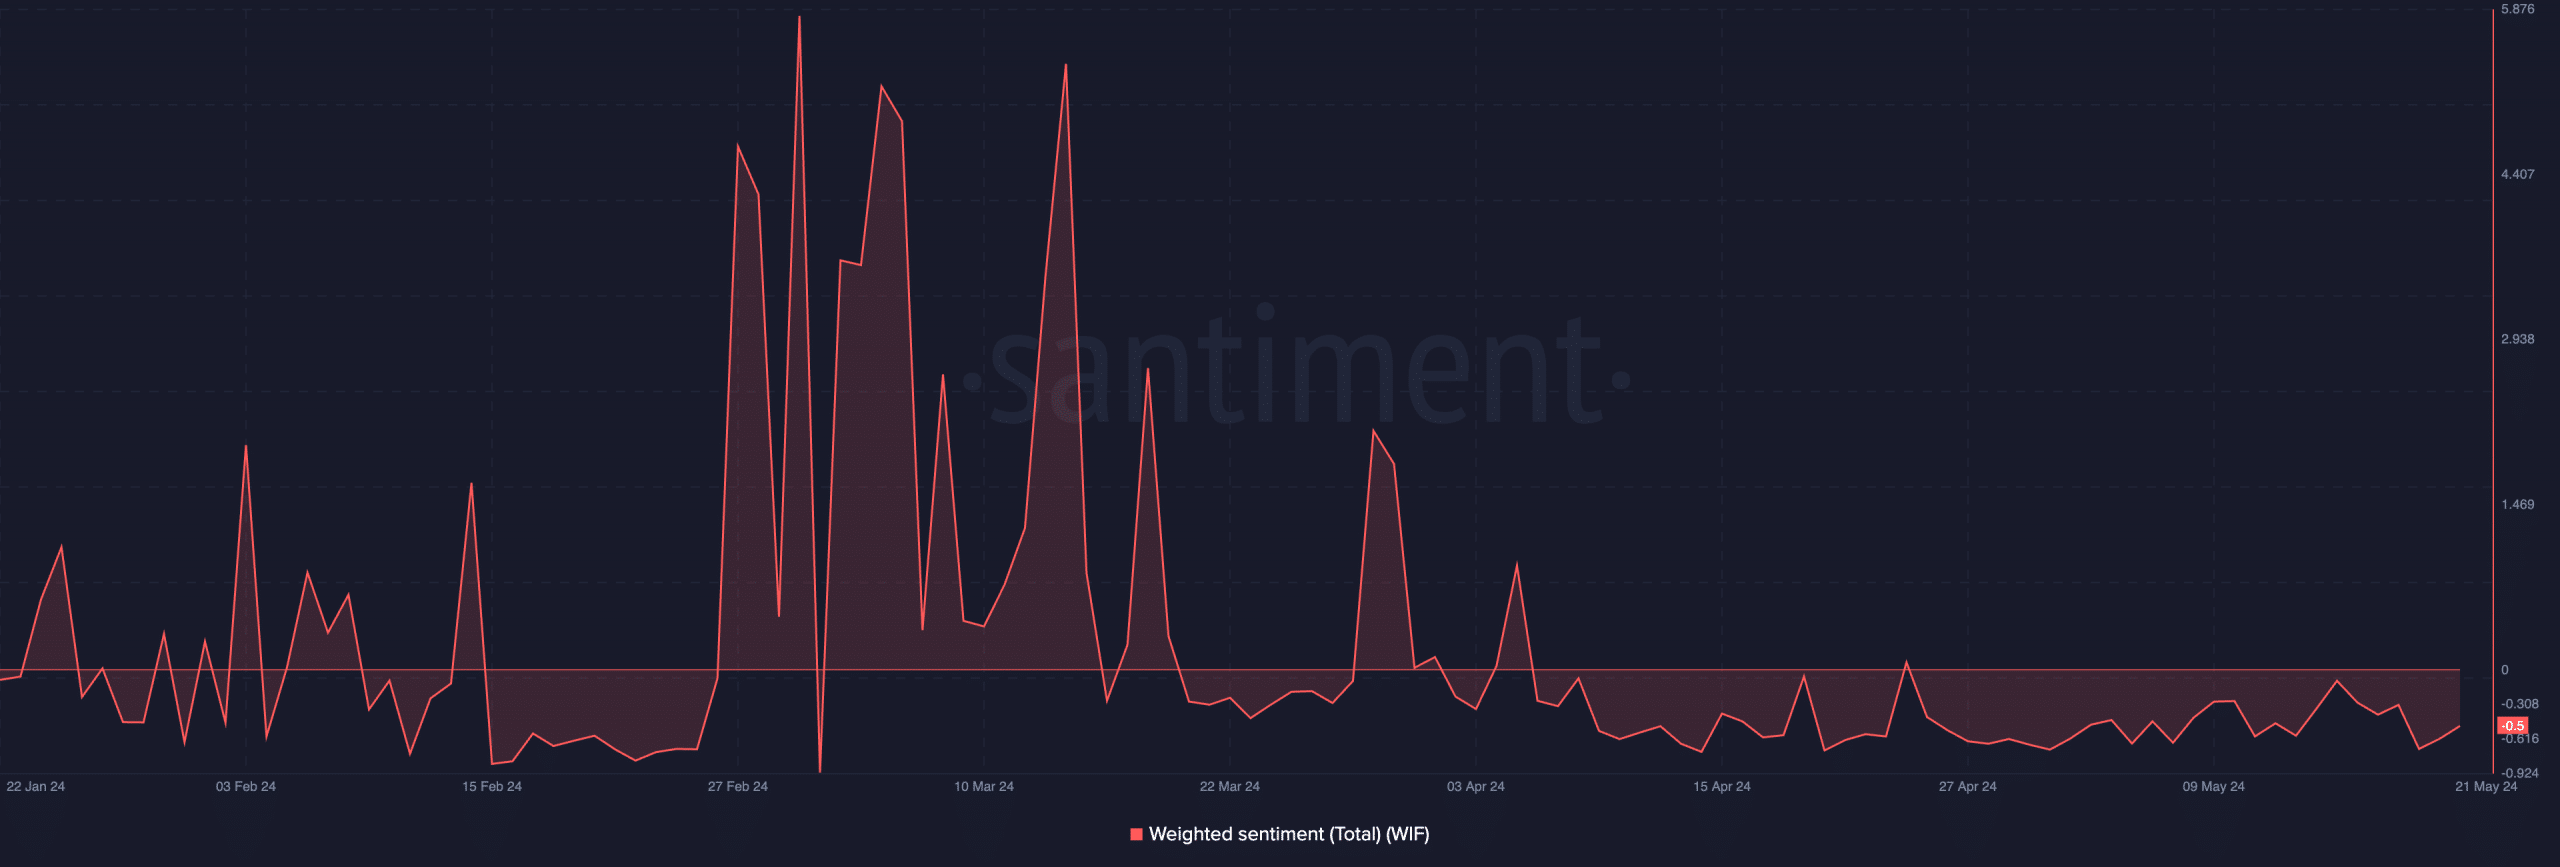
Looking at the weighted sentiment of the tokens, confidence in the above position has increased. At press time, it was -0.5, according to Santiment’s data.


Source: Santiment
Read 2024-25 price prediction for dogwifhat (WIF)
When an asset registers a negative weight sentiment, it usually indicates a downward trend in investor confidence.
Bad sentiments often lead to distributions as some investors may be inclined to sell their holdings due to lack of confidence in the short-term price appreciation of the asset.

