- LINK has fallen more than 6% over the last 7 days.
- Buying pressure on LINK was high, but indicators suggested a price decline.
Chainlink (LINK) On July 7th, a promising bullish rally began, suggesting a recovery from last week’s losses. However, LINK failed to sustain its gains and soon lost its upward momentum.
Let’s take a closer look at what’s happening at LINK and what you can expect going forward.
Sell signal appears on LINK chart
CoinMarketCap’s data LINK’s price has dropped by more than 6% over the past seven days. However, things have started to improve as the token price has risen to $13.2 in the past 24 hours, but the trend was short-lived.
Chainlink’s price has risen by just 2% over the past day, and at the time of writing, it is trading at $12.81, giving it a market cap of over $7.79 billion.
Popular cryptocurrency analyst Ali posted: Twitter This highlights the potential reason for the decline: According to the tweet, a sell signal has appeared on the token’s 4-hour chart.
If that is true, we may see a few more red candlesticks on the token’s 4-hour chart. Does this mean that this bearish trend is going to last? Let’s take a look at what the indicators are suggesting.
LINK Buying Pressure Is High
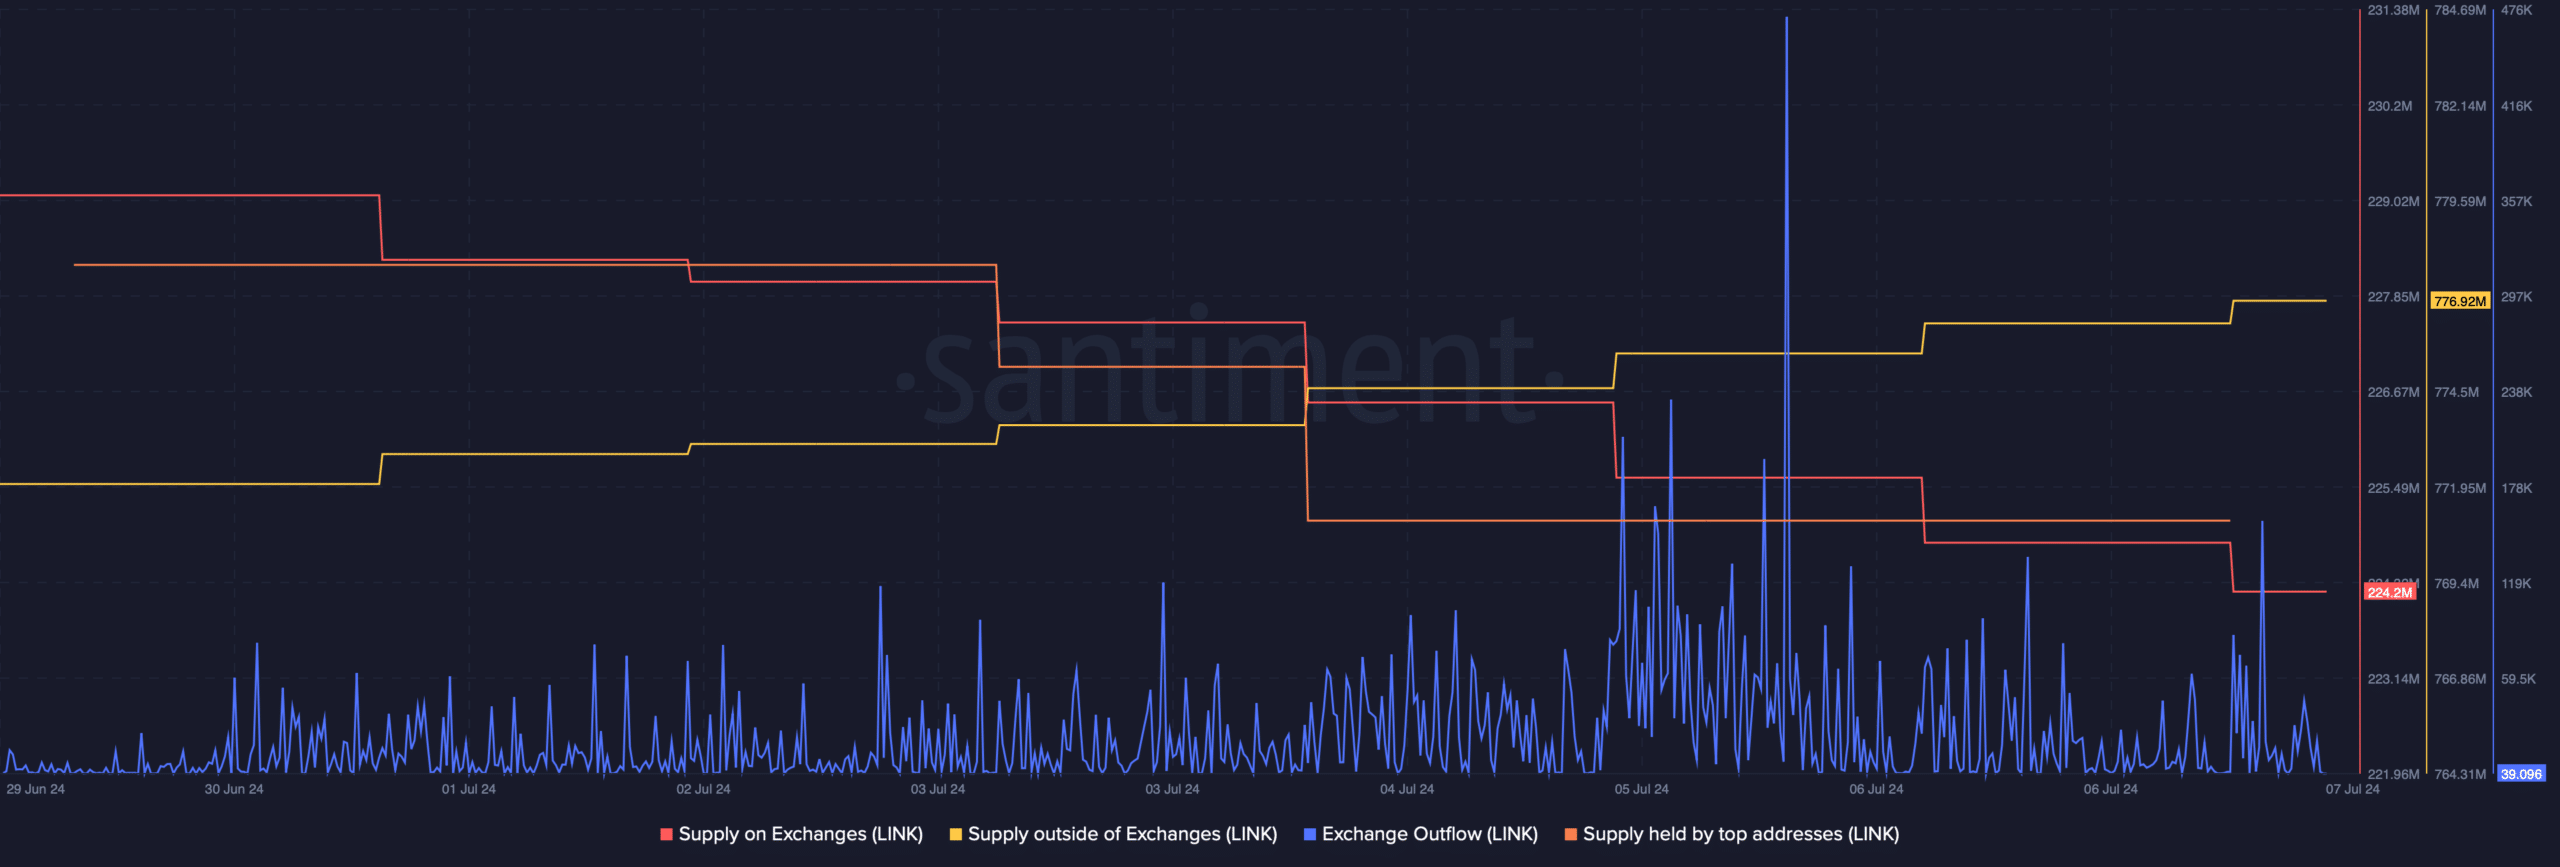
AMBCrypto’s analysis of Santiment data shows that investors are still buying LINK, which is generally considered bullish. This seems to be the case with the surge in LINK exchange outflows a few days ago.
Additionally, while on-exchange supply decreased, off-exchange supply increased, further demonstrating that buying pressure was high.
Despite this, whales were not very confident in LINK and sold their tokens last week as the supply held by top addresses dropped.

Source: Santiment
Another positive indicator is Chainlink’s Fear and Greed IndexAt the time of writing, it was worth 23%, meaning the market was in a “fear” phase.
Each time this happens, it indicates a high probability of a price increase. Then I decided to take a look at the daily chart of the token.
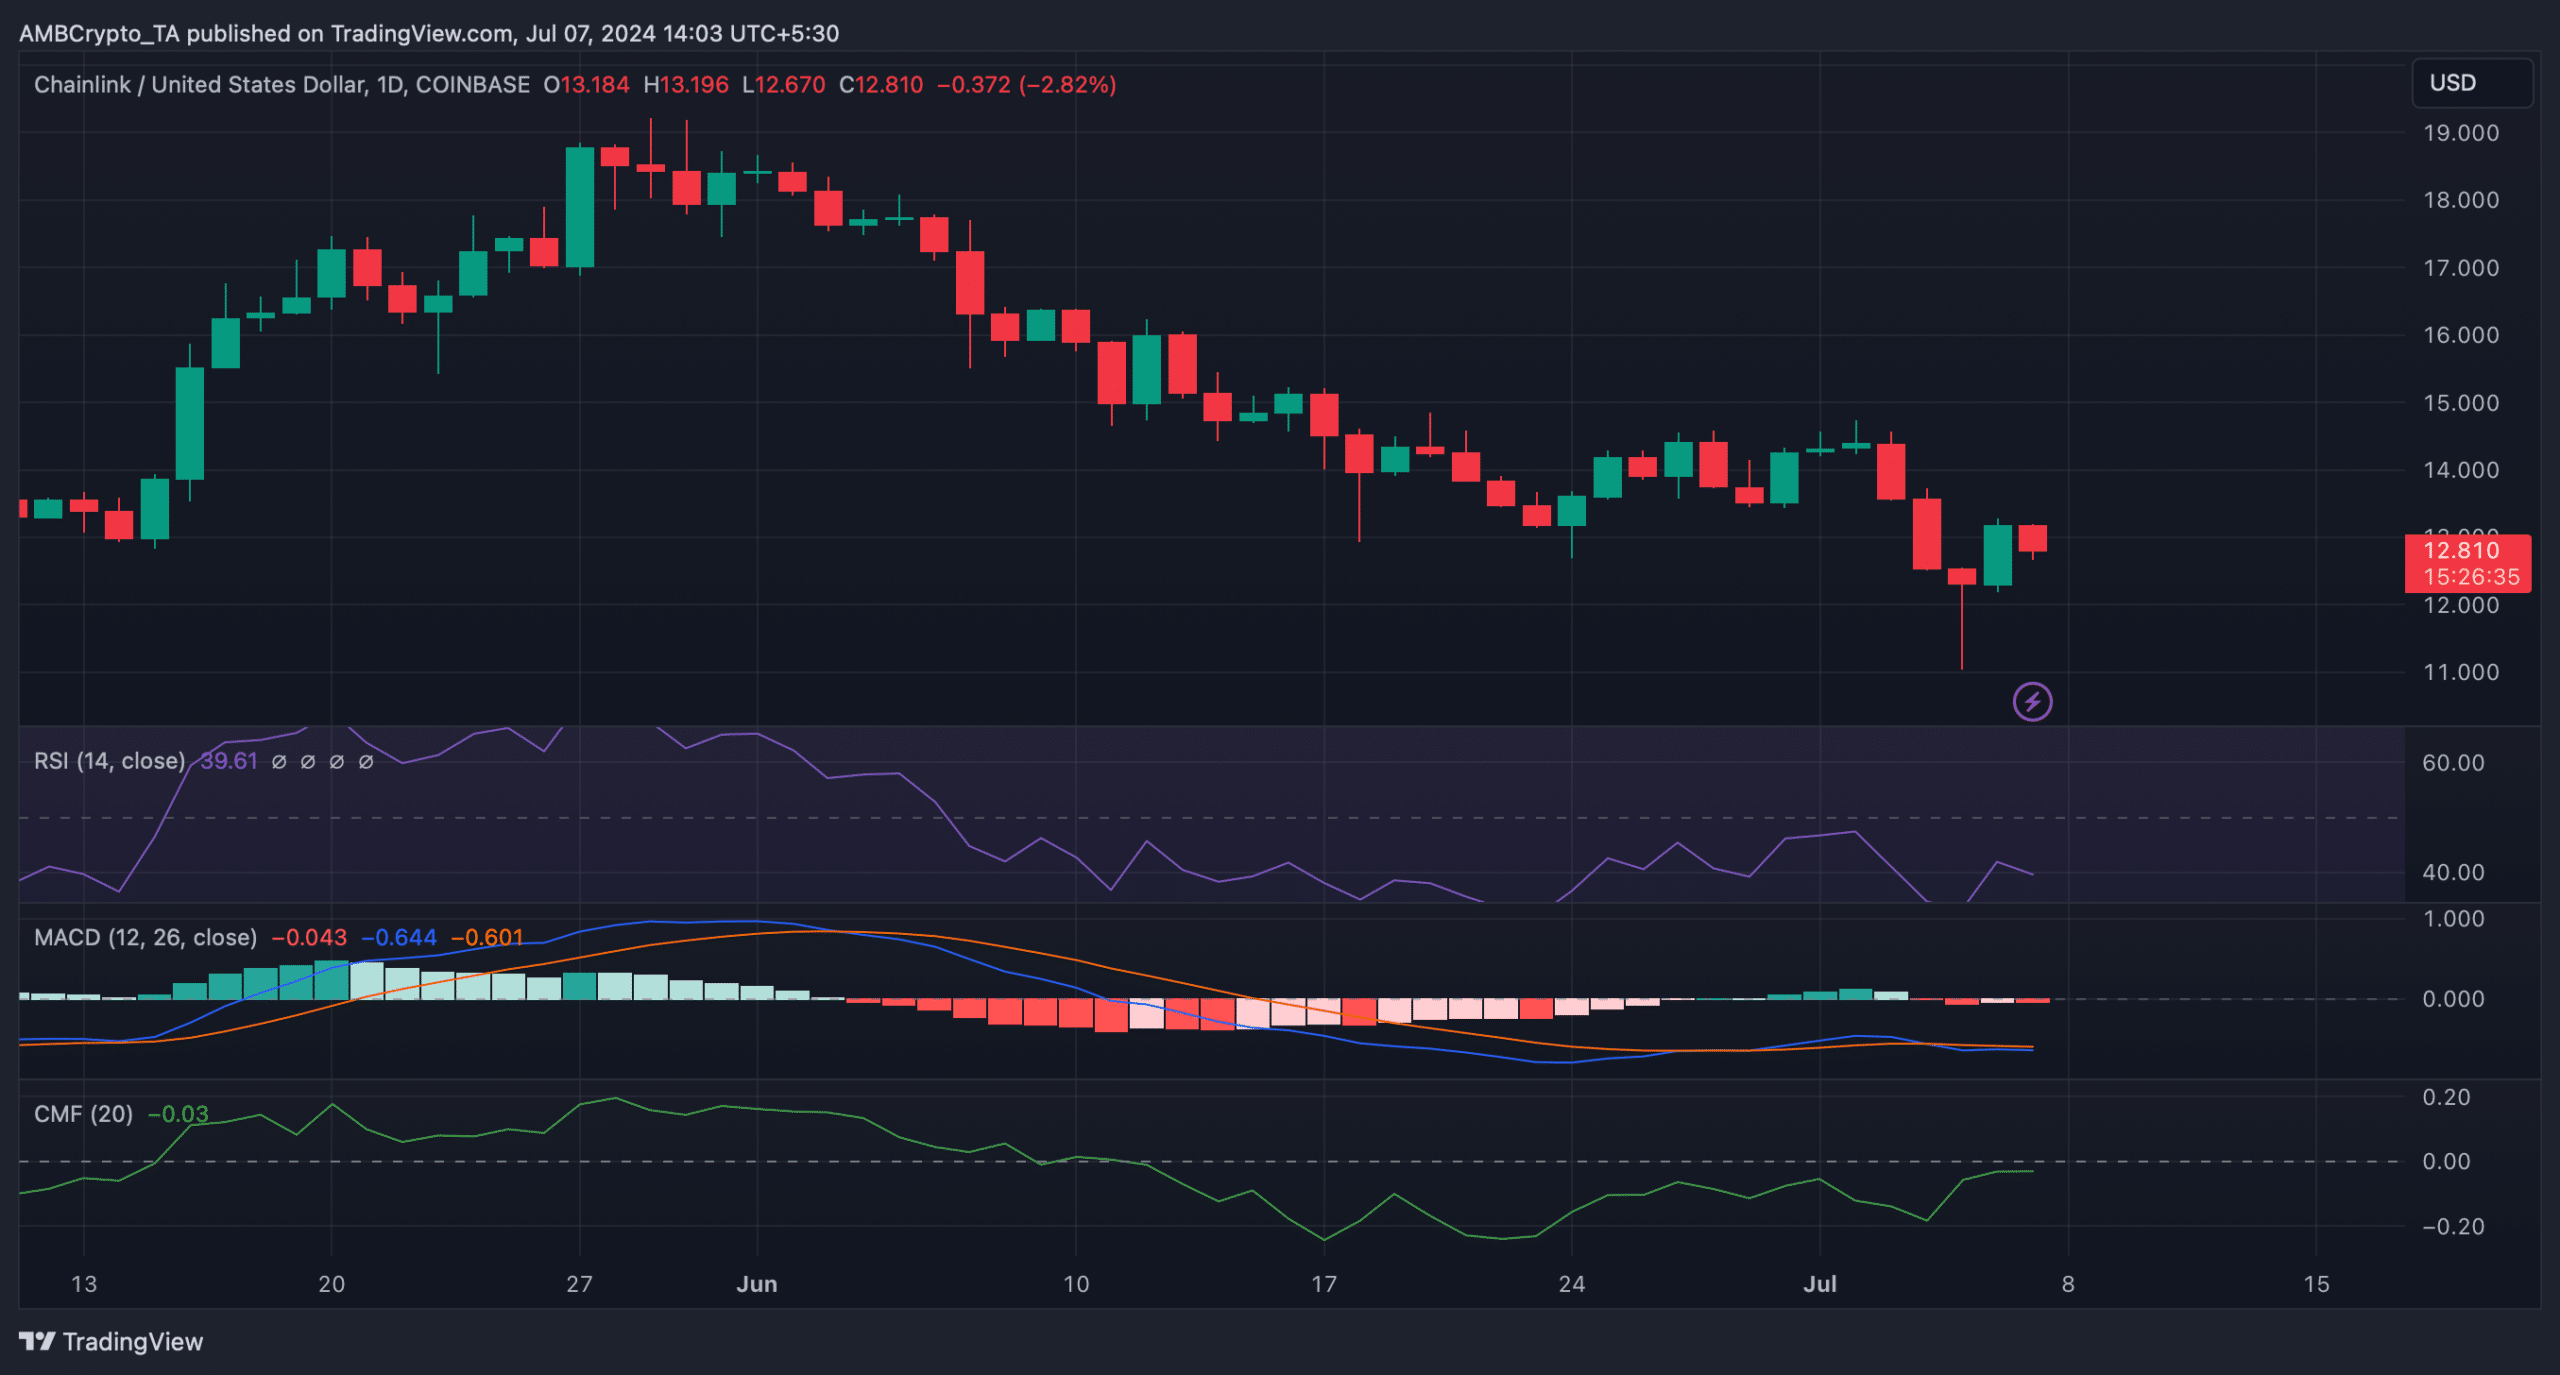
However, market indicators looked quite bearish. For example, the MACD showed a bearish crossover. Chaikin Money Flow (CMF) moved south.
Additionally, the Relative Strength Index (RSI) is showing a similar trend, signaling a price decline.


Source: TradingView
Realistic or not, here it is. LINK market cap in terms of BTC
Based on our analysis of Hyblock Capital data, if a bear market were to unfold and the LINK chart were to turn red, it would not be surprising to see LINK drop to $11.
Conversely, if an uptrend begins, investors could see LINK soon hitting $15.


Source: Hyblock Capital

