Market Outlook #246 (20th November 2023)
Hello, and welcome to the 246th instalment of my Market Outlook.
In this week’s post, I will be covering Bitcoin, Ethereum, Polygon, Avalanche, Uniswap, Beam, Sushi and LayerAI.
Most of these have been reader requests this week – as ever, send those across to me for next week’s inclusion if there’s something specific you want looking at.
Bitcoin:
Weekly:
Daily:
Price: $37.263
Market Cap: $728.411bn
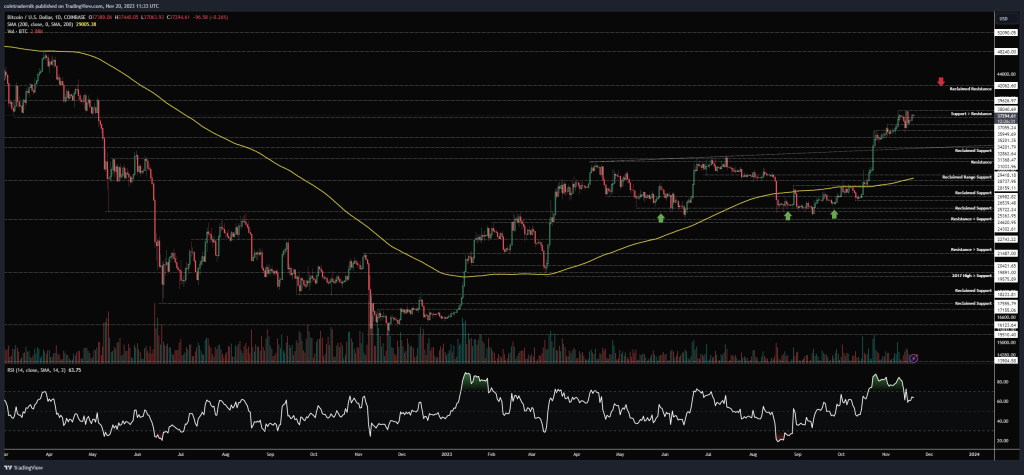
Thoughts: If we begin by looking at BTC/USD, on the weekly timeframe we can see that price closed last week at marginal new yearly highs, having wicked lower towards the prior weekly low before bouncing back above the $36k area and closing shy of $38k resistance. Whilst this was a great show of strength from bulls and there are still no signs yet that we have topped on this timeframe, the fact we now have three consecutive weekly lows unswept since the breakout candle is something to keep in mind for when we inevitably do mark out a local top. We are sat right around prior support here and above $38k we have no resistance into $39.6k, which I think would be a pit stop before the inevitable run into that major confluence of resistance at $42k: this is where we have an important historical level as well as the 50% fib retracement of the entire bear market. No doubt, if we can accept above last week’s high this week, then that’s the level we’re headed for before marking out any top. If, however, we wick above $38k and close the weekly back below it, I think it looks more likely we need some sort of sweep of downside liquidity before continuation.
Turning to the daily, we can see that price is making higher lows on the daily having reset RSI after the momentum divergence, and prior resistance has become support at $36k. Holding above that early this week is key – break below it and I think we’re looking at a move back towards $34.2k at the least. Above it, however, I think we continue to push, with daily closes above $38k opening up the next leg higher after this consolidation towards $39.6k and then $42k. Nothing else to add here really except that, if we do get a dip after this huge rally, I would be looking at the range between $31k-34k as a prime buying opportunity for 2024.
Ethereum:
ETH/USD
Weekly:
Daily:
ETH/BTC
Weekly:
Daily:
Price: $2029 (0.05447 BTC)
Market Cap: $244.205bn
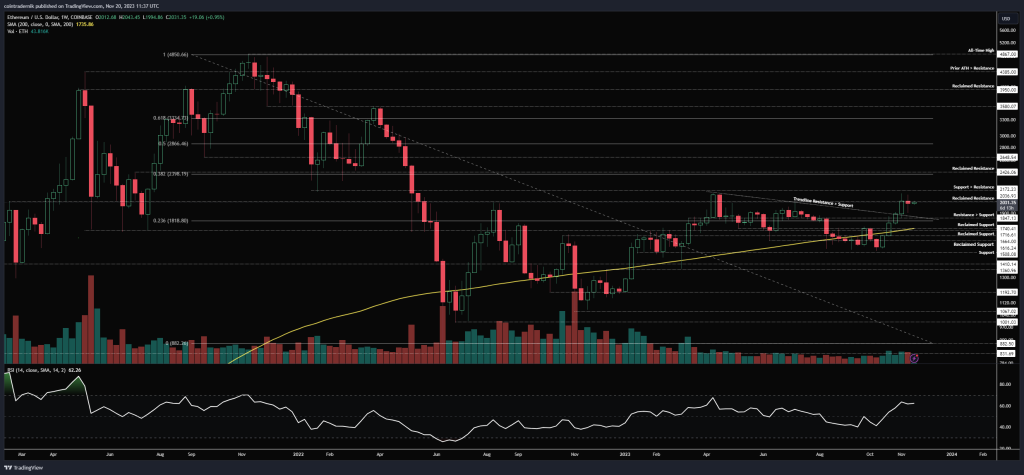
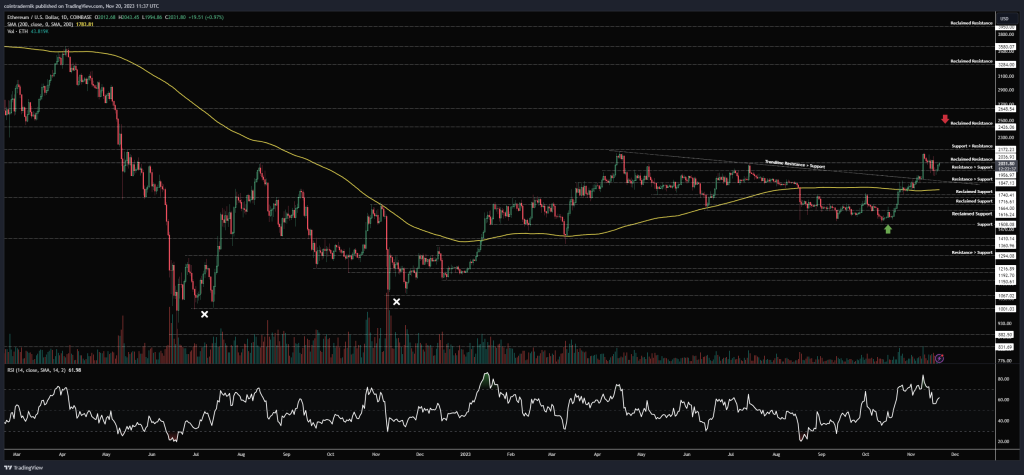
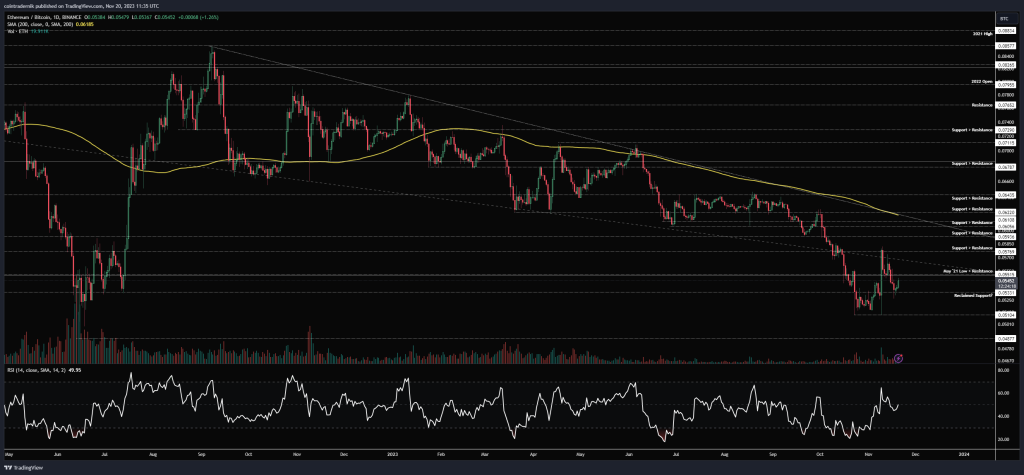
Thoughts: If we begin by looking at ETH/USD, we can see from the weekly that price moved lower to retest the trendline as support, bouncing and closing right back near the weekly open, just below reclaimed resistance at $2037. There is nothing about this that currently looks bearish to me: we have a strong trendline breakout, with that trendline acting as support, and consolidation right at an important resistance level. Above $1850, this remains the case, in my view. If we close the weekly back below $1850, it’s likely we move to retest that $1717-1740 range as support, where bulls would seek to form a higher-low. But for now, I expect to see any acceptance above $2037 this week lead to $2172 giving way and then a squeeze to fill in the gap into $2425. Dropping into the daily, we can see that RSI has reset as price retraced into resistance turned support, failing to close below $1957 on multiple attempts. From there, price has pushed up into $2036, which is key resistance. Bulls want to see a daily close above this followed by that level acting as support. If we see that, long your longs towards $2425. On this timeframe, signs of weakness would be rejection here followed by a daily close below $1957.
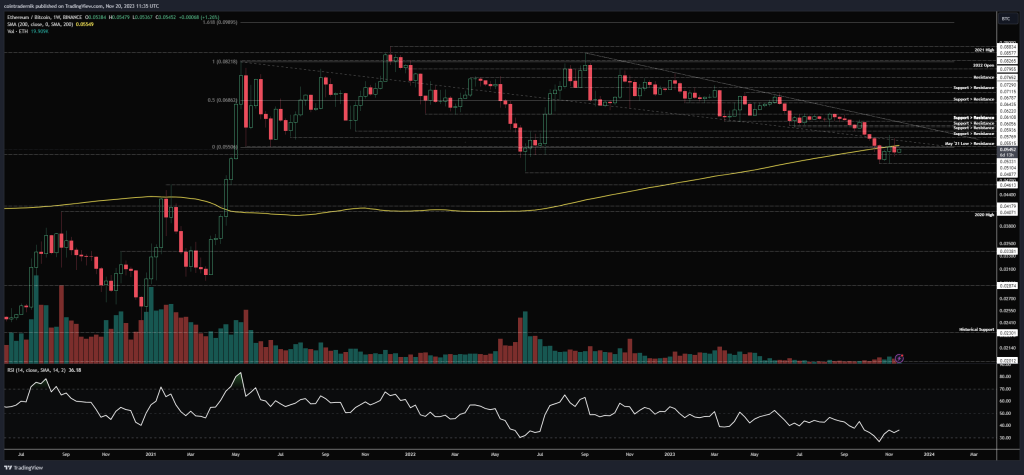
Turning to ETH/BTC, we can see that price rejected above the 200wMA again last week, with 0.0577 acting as resistance and sending the pair back below 0.055, with it closing at 0.0538. We are currently sat between reclaimed support at 0.053 and the 200wMA as resistance. Obviously, the bullish scenario here would be a weekly reclaim of 0.055 as support – in that scenario, I think we see ETH outperform for a few weeks, pushing up into that trendline. However, if we now reject the 200wMA again and start closing below 0.053, I think the yearly lows at 0.051 get taken out and price runs into 0.0487. Looking at the daily, we can see how 0.0533 is acting as good support at present but daily structure is bearish following the break back below 0.055; bulls really need to see that level flipped as support once again and then we can expect to see another test of 0.0577. Very clean structure here.
Polygon:
MATIC/USD
Weekly:
Daily:
MATIC/BTC
Weekly:
Daily:
Price: $0.858 (2303 satoshis)
Market Cap: $7.972bn
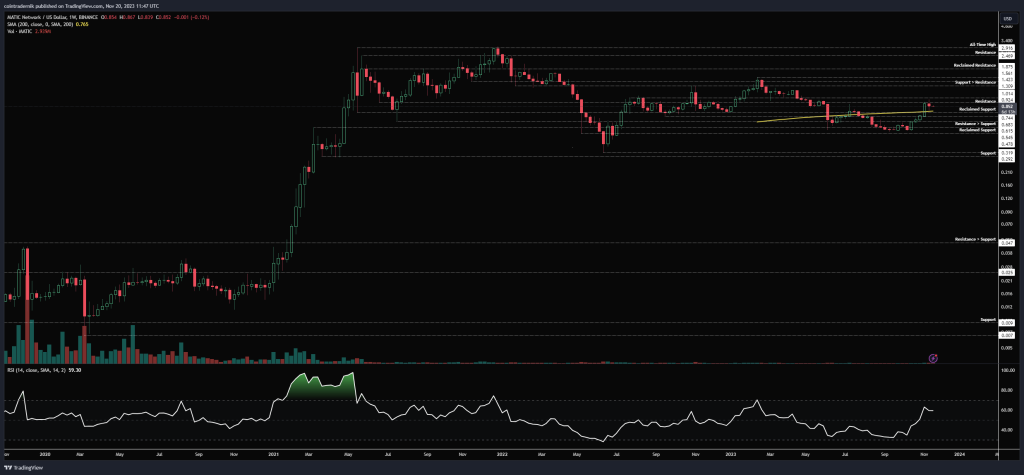
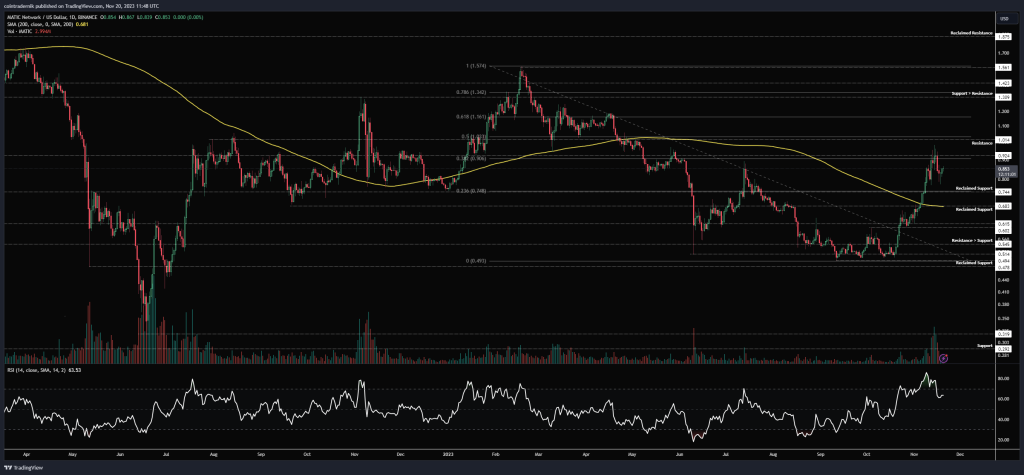
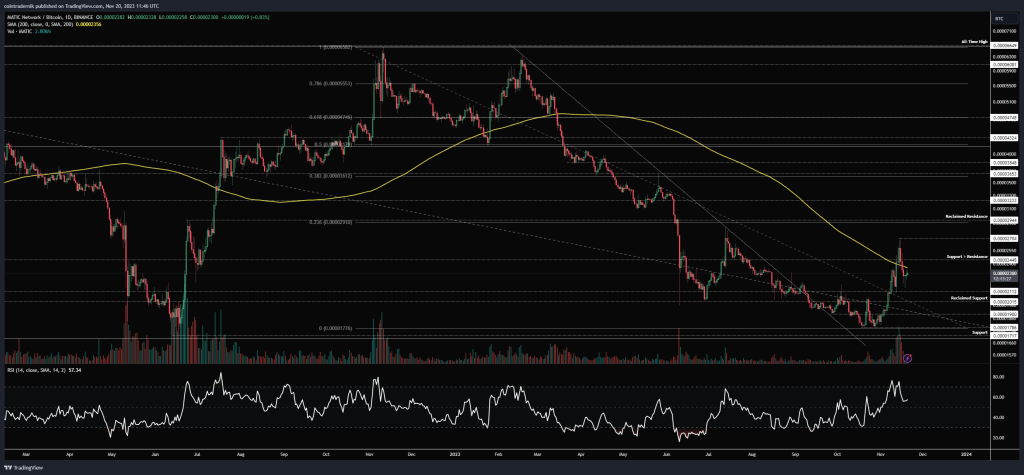
Thoughts: If we begin by looking at MATIC/USD, on the weekly we can see from the weekly that price has rallied for several weeks after forming a bottom above reclaimed support at $0.47, pushing through the 200wMA a couple of weeks ago and then rejecting just shy of $1 resistance last week, with price now sat above reclaimed support at $0.75 and below $0.93 as resistance. From here, I would expect to see the 200wMA act as support if this is to remain short-term bullish, with any weekly close back below $0.75 opening up a deeper retracement towards $0.62 to form a higher-low above the September-October bottom there. If $0.75 holds this week, I would expect another crack at $1 to follow with nothing above that for another 30% into $1.31. Dropping into the daily, we can see how price rejected right around the 38.2% retracement of the bear market, with the 50% confluent with that $1 area. Obviously, for bulls, $0.92 cannot now act as resistance on a retest from below, else we have a lower high and one would imagine a deeper pull-back would follow, with the 200dMA aligned with reclaimed support at $0.68 as a first area of interest. Accept back above $0.92 and this is gonna squeeze much higher, in my opinion.
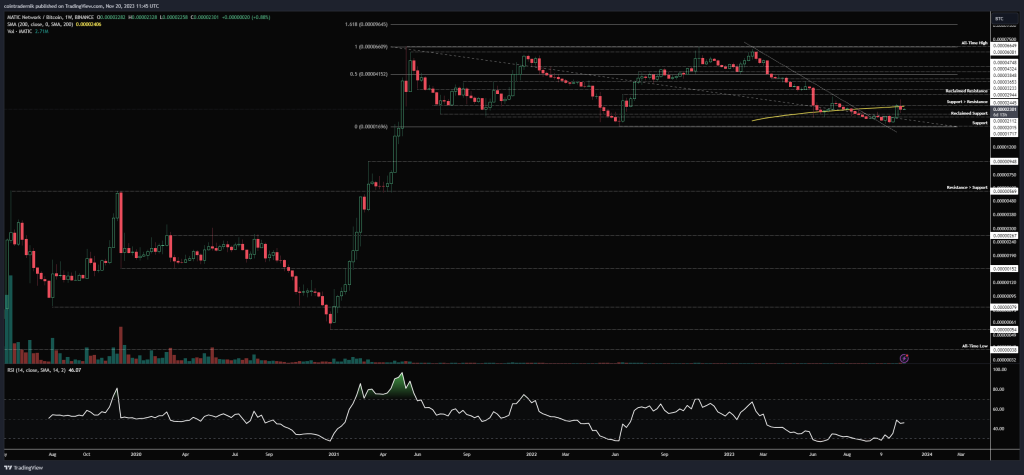
Turning to MATIC/BTC, we can see here that price rejected below the 200wMA, confirming it as resistance at 2450 satoshis and is now sandwiched between reclaimed support at 2100 and that 200wMA and prior support. Closing the weekly back above this would be a hugely promising sign for bulls, and I would expect a gap fill to follow back towards 3200 satoshis from there. If we close the weekly back below 2100, that invalidates a lot of this structure and bulls are back at square one, with the multi-year lows at 1700 satoshis in plain sight…
Avalanche:
AVAX/USD
Weekly:
Daily:
AVAX/BTC
Weekly:
Daily:
Price: $22.17 (59,514 satoshis)
Market Cap: $7.926bn
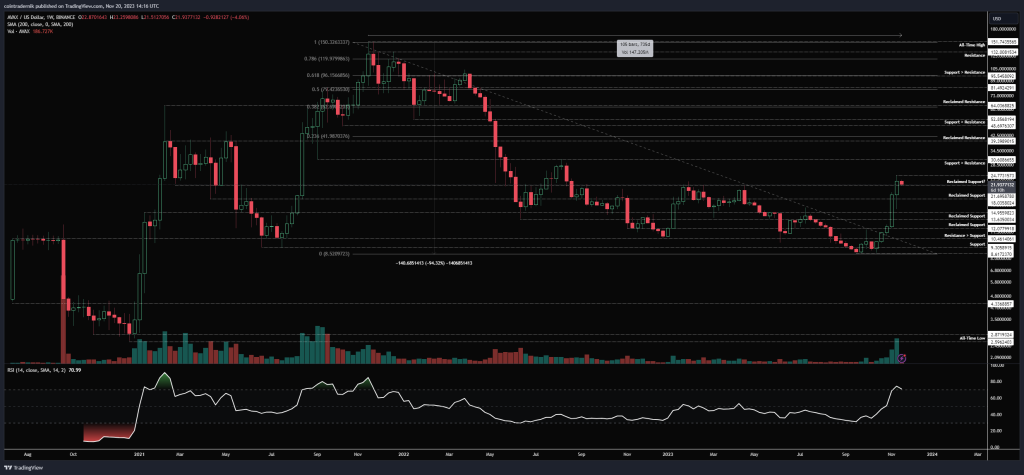
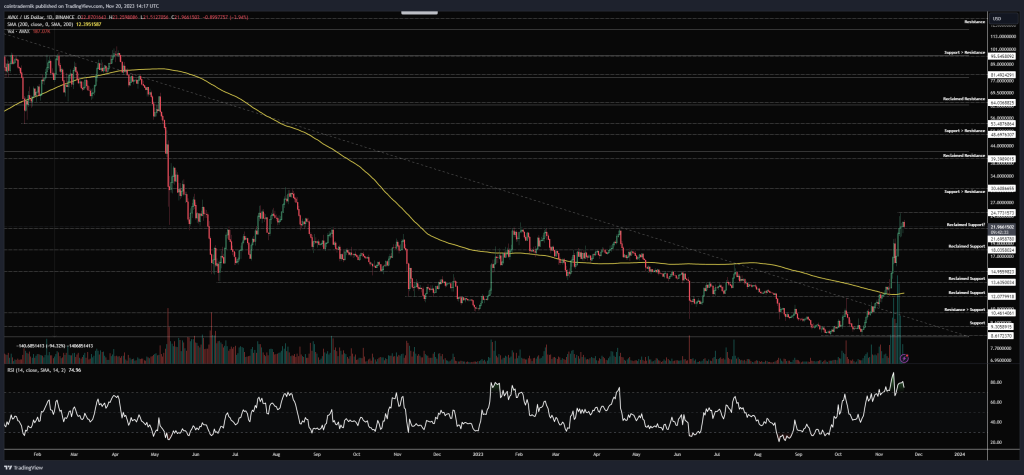
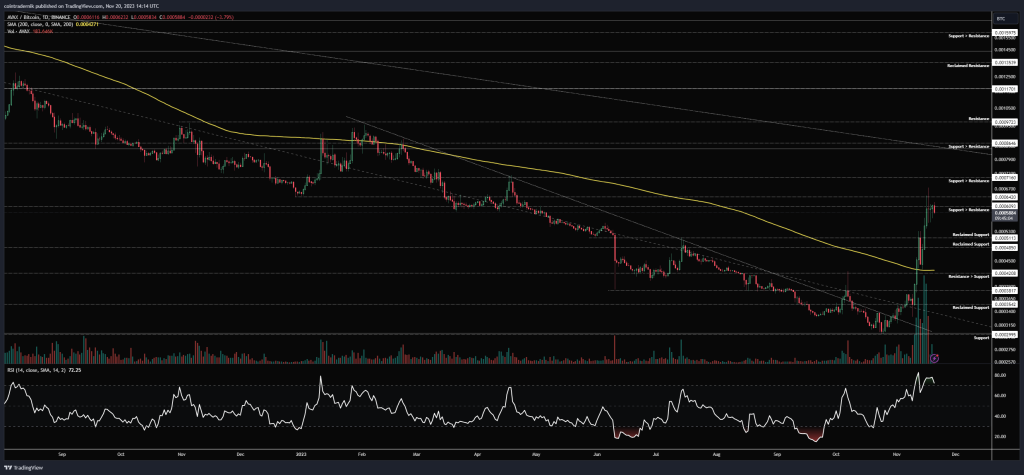
Thoughts: Beginning with AVAX/USD, we can see from the weekly that price has been on a tear this past few months, rallying from the multi-year lows at $8.60 all the way into $24.77 last week, closing marginally above support turned resistance at $21.70 that had capped the highs all year. Volume continues to grow but if we now see price break back below $21.70, I would be looking for $18 to hold as a higher-low given the strength of the rally. Looking at the daily for more clarity, we can see how above this level there is very little resistance at all back into $30, so any opportunity to get long on a pull-back here would be golden; there is some momentum exhaustion creeping in and if we do see price retrace into $18, I will be looking for signs to get long on the lower timeframes, with a view to hold for that $30 level. Below $18, a deeper pull-back would have us looking at the range between $12-15 for entries. Of course, if we aren’t gifted a pull-back at all and $21 acts as support this week, a daily close above $25 will likely lead to the rest of that range getting filled in quite quickly.
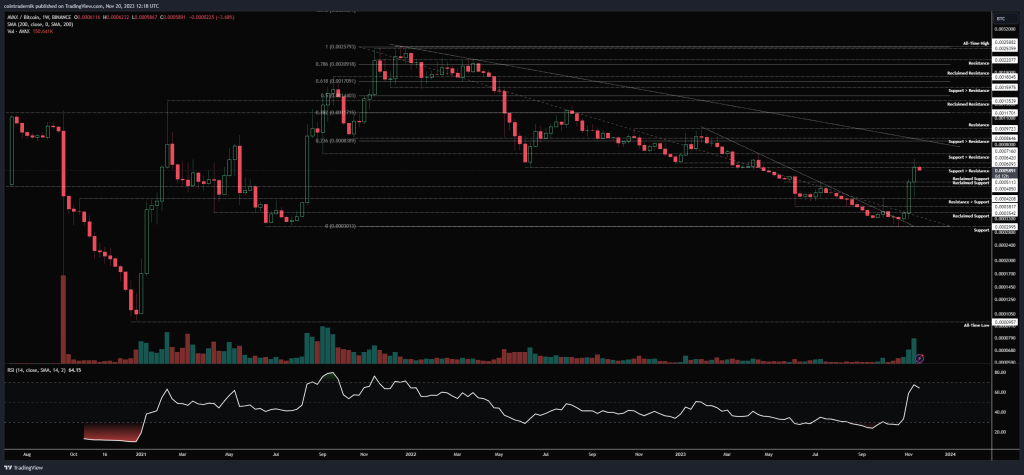
Turning to AVAX/BTC, we can see that price has rallied right into a major level of prior support turned resistance, right at the May 2022 bottom around 60k satoshis. Last week, price wicked above this level but closed back at the level, and we now have a really strong range of reclaimed support below at 48.5-41k satoshis where a higher-low may look to form. If we do see that higher-low formation, and that aligns with an entry based on the Dollar pair, the next area of resistance above 60k is that trendline and the 23.6% fib retracement at 84k satoshis…
Uniswap:
UNI/USD
Weekly:
Daily:
UNI/BTC
Weekly:
Daily:
Price: $5.26 (14,109 satoshis)
Market Cap: $3.969bn
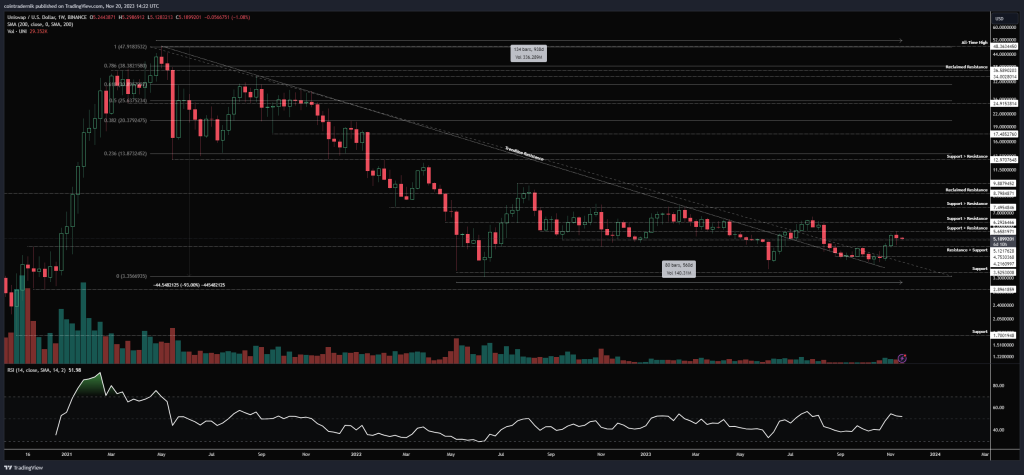
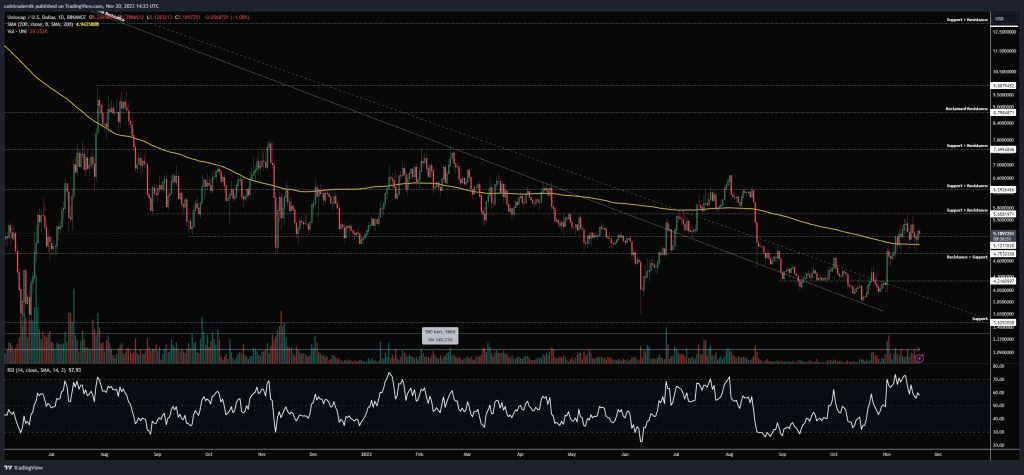
Thoughts: Beginning with UNI/USD, we can see that price has finally turned market structure bullish again on the weekly after deviation below support at $4.21 led to a bounce off trendline resistance turned support and subsequent rally back above the level, with price closing firmly above $4.75 and continuing higher. We are now sat with $4.75 having acted as support last week and $5.68 as resistance above; if we can hold above $4.75, I would expect this minor resistance to give way with $6.30 the major level above to watch for. However, if we see price break below that reclaimed support at last week’s low, I am looking for a return to $4.21 for an opportunity at a leveraged long. I do have a spot position but I would like to get levered exposure as close to $4.21 as I can get it if possible. Dropping into the daily, we can see how price reclaimed the 200dMA which is now acting as support, but given how that played out last time (August) it provides confluence for the importance of holding above $4.75 here for bulls. Above $5.68, there is air into $6.30 and then into $7.50. Let’s see if we get the golden opportunity for a leveraged long…
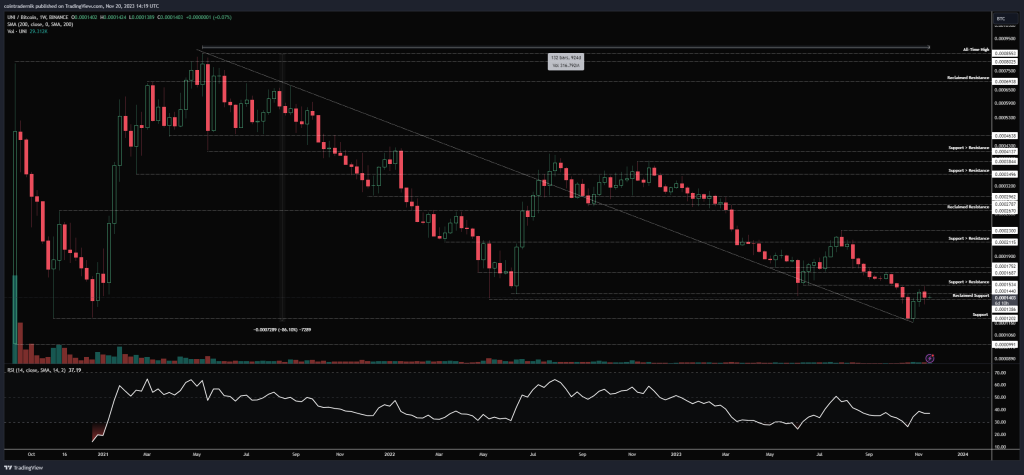
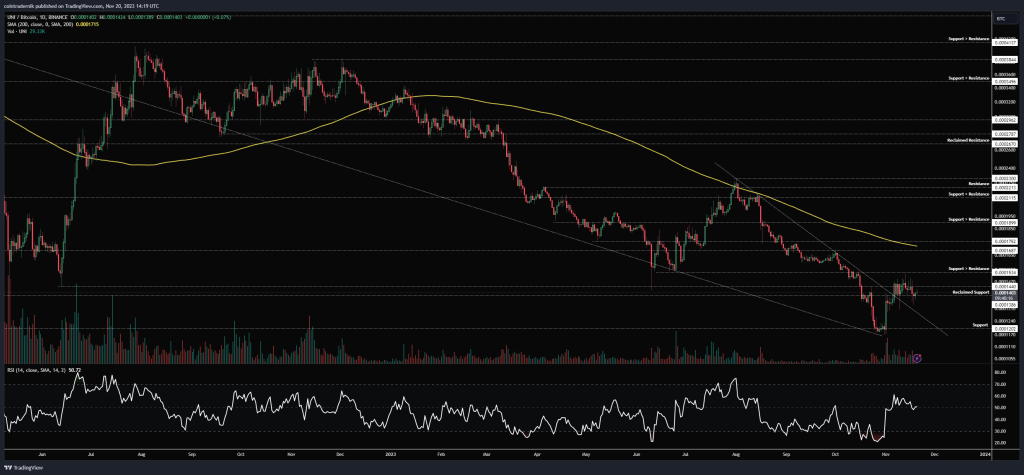
Turning to UNI/BTC, we can see that price broke below the double bottom at 14.4k satoshis a few weeks ago, capitulating into multi-year support at 12k satoshis and then reclaiming 14k satoshis as support since. Price is now sandwiched in between prior support turned resistance at 15.3k satoshis and support at 14k. If this level gives way again, I think 12k is getting taken out and price runs the all-time low at 9.9k satoshis, which would be an incredible long-term buying opportunity if we are to expect UNI to remain important next cycle. Until this is back above 17k satoshis, however, I don’t think it looks particularly strong.
Beam / Merit Circle:
BEAMX/USD
Daily:
Price: $0.0092 (25 satoshis)
Market Cap: $400.281mn
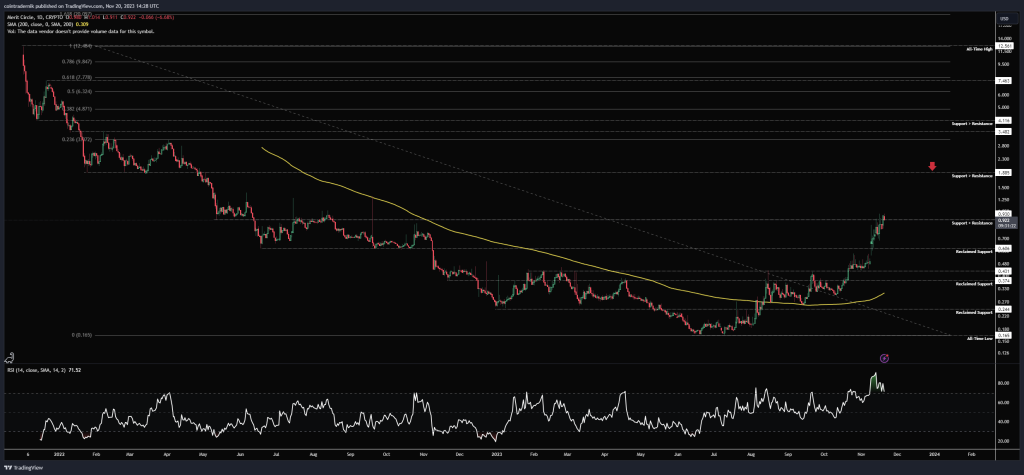
Thoughts: Whilst I am aware MC is now BEAM or BEAMX, for the purposes of analysis I have shared the MC/USD chart here so that we can see all of price-history.
Looking at this, we can see how strong the reversal has been since turning the 200dMA into support, with price now pushing up again $0.93 as resistance, with that level also being the last major resistance level between here and the next level – 100% higher at $1.88. We are seeing some momentum exhaustion here as we come into this resistance, so if we are to mark out a local top it would likely be around here, but I would expect any pull-back into $0.60 to be gobbled up given the strength shown thus far. For those looking for an entry, I would look for $0.60-0.65 as a first area of interest for spot, followed by $0.44 if you are lucky enough to get it. For those already on the train, enjoy the ride, as I am expecting at least $4 to be hit in 2024.
Sushi:
SUSHI/USD
Weekly:
Daily:
SUSHI/BTC
Weekly:
Daily:
Price: $1.08 (2892 satoshis)
Market Cap: $208.653mn
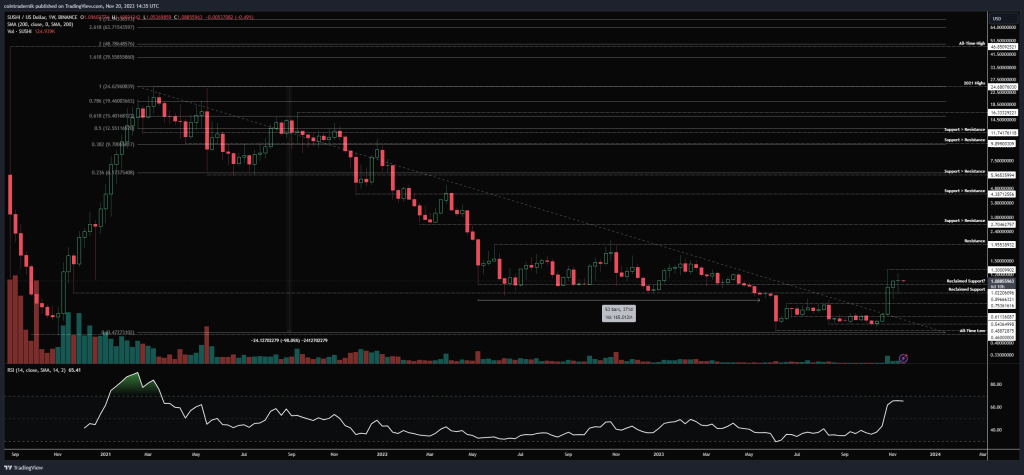
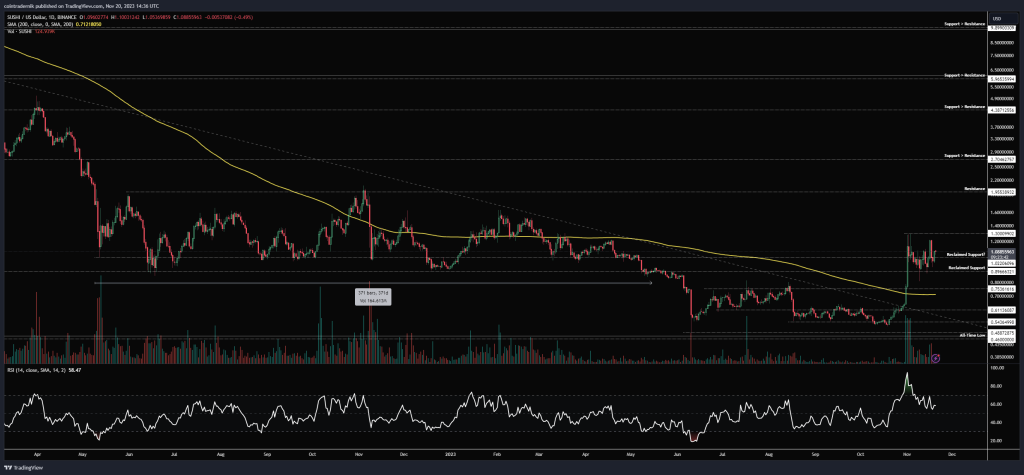
Thoughts: Beginning with SUSHI/USD, we can see from the weekly that price has played out its bear market in a textbook fashion, capitulating into $0.48 (just above the all-time lows) in May before forming a multi-month range above this level. Price then ripped higher, rallying through $0.75 to turn weekly structure bullish and continuing through the year-long support for, 2022 at $0.90. Price has since been consolidating above that level as reclaimed support, and continuing to hold above this level would be very promising indeed for SUSHI bulls. If we do get a pull-back, watch for a sharp wick below $0.90 towards $0.75 and immediate reclaim of the level as support. That would be a signal to get long if we see it. If we drop into the daily for clarity, we can see how a swift move into $0.75 would also mark out a retest of prior resistance and the 200dMA as support, but I don’t know if we are going to be granted such an opportunity. If not, I would be looking for a daily close above $1.30 and then look to long the next pull-back for the range play back into $2.
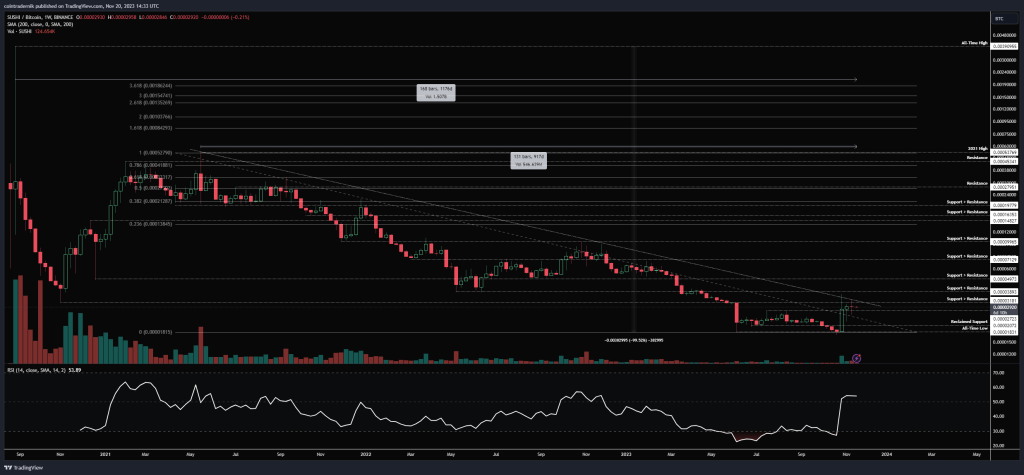
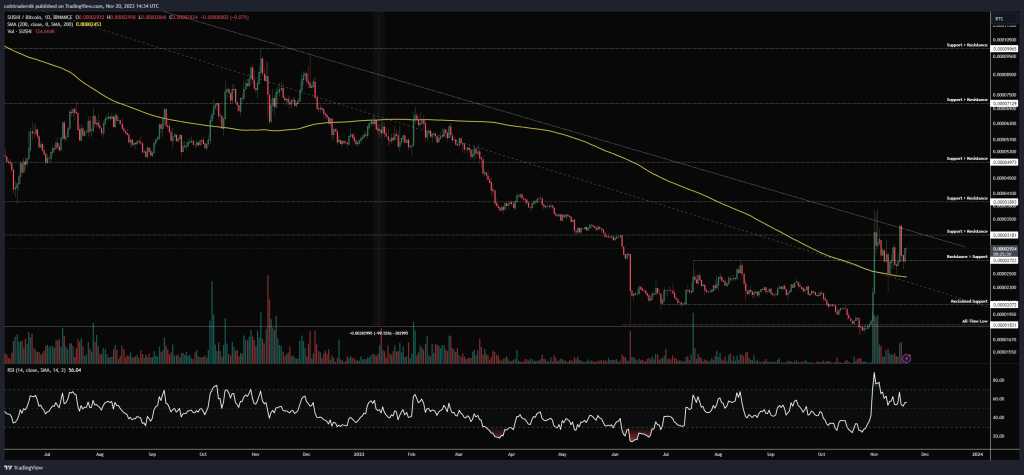
Turning to SUSHI/BTC, we can see that unlike the Dollar pair this is still capped by trendline resistance from the 2021 highs, but weekly structure is now bullish and price is consolidating above prior resistance at 2700 satoshis. Obviously, the key here for bulls is to hold this level as support and then see a high volume breakout above the trendline, reclaiming the May 2022 lows at 3900 satoshis as support in the process. If and when we see that, no doubt the beginning of SUSHI’s next bull cycle is underway, in my view. If this trendline caps price here however and we move back below 2700, I think we see the all-time lows retested, with a deviation and reclaim of 1830 being the golden opportunity and likely the spring for the next cycle to begin. Let’s see how things unfold…
LayerAI:
LAI/USD
Daily:
Price: $0.0124 (33 satoshis)
Market Cap: $3.951mn
Thoughts: Finally, let’s take a look at LayerAI – a microcap that has started looking very promising, particularly given the AI narrative that is bound to grow in 2024.
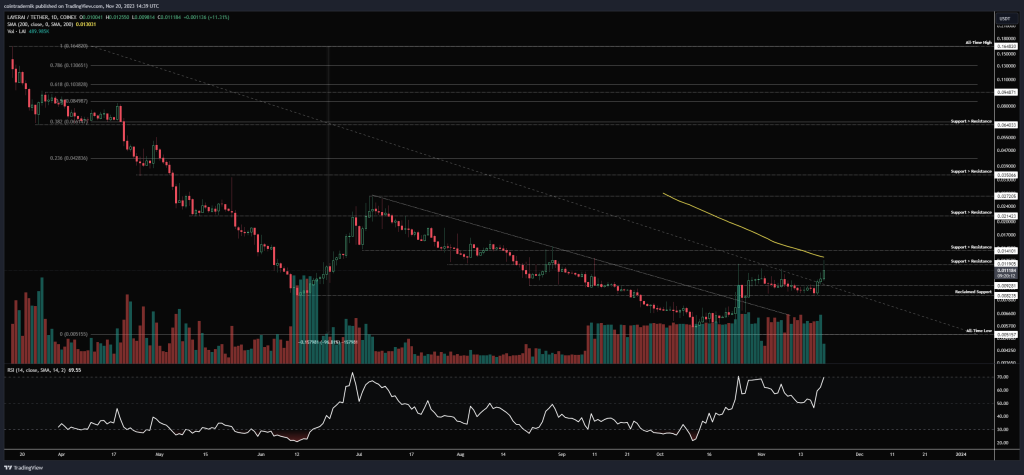
If we look at LAI/USD, we cam see that price lost 97% of its value from the all-time high back in March into an all-time low at $0.005 in October, then rallying off that low to reclaim the June support at $0.0082 a few weeks ago on growing volume. Price also closed above trendline resistance, turning it into support, and has since been consolidating between $0.0082 as support and resistance at $0.012, where the 200dMA is also sat. We have daily bullish structure here also, and I have been buying within this range the past week, looking to add on acceptance above $0.014, with a view to hold for a full cycle (new all-time highs likely, in my opinion). Invalidation is a close back below $0.0082.
And that concludes this week’s Market Outlook.
I hope you’ve found value in the read and thank you for supporting my work!
As ever, feel free to leave any comments or questions below, or email me directly at nik@altcointradershandbook.com.

