

- The renders show a potential bullish reversal as it approaches the critical resistance at $6.63.
- Market sentiment is strong, driven by a long-short ratio favoring buying and high trading volume.
Render (RNDR) continues to dominate the Decentralized Physical Infrastructure Network (DePIN) sector, with a whopping $2 billion market capitalization and $103 million daily trading volume.
At press time, Render is trading at $4.89, down 4.18% from last week. However, signs are pointing to a potential reversal as Render’s technical and market indicators attract investor attention.
Could this be the turning point that leads Render to a bullish breakout?
RNDR Price Action Analysis: Key Levels to Watch
The price chart shows consolidation within a downward channel. The critical resistance level at $6.63 acts as a strong barrier.
Therefore, a clear break above this level could signal a bullish reversal. Analysis of the MACD shows that a convergence pattern is forming, which suggests selling pressure is easing.
Additionally, RSI is currently sitting at 43.01, slightly below the neutral level, suggesting that there may be room for buyers to intervene while the bears remain in control.
If the render gains momentum, it could push towards $6.63 resistance, setting the stage for a potential uptrend.
Source: TradingView
RNDR Price DAA Divergence: Warning Sign or Opportunity?
The Daily Active Addresses (DAA) quarterly chart for RNDR highlights a significant negative quarterly period, with recent levels as low as -303.85%.
This difference indicates a discrepancy between prices and active addresses, meaning there is a lack of corresponding increase in network activity with recent price attempts.
However, if Render experiences a surge in active addresses, this difference could reverse and provide important support to the price. Changes in network activity can therefore play a pivotal role in strengthening the price stability of RNDR.
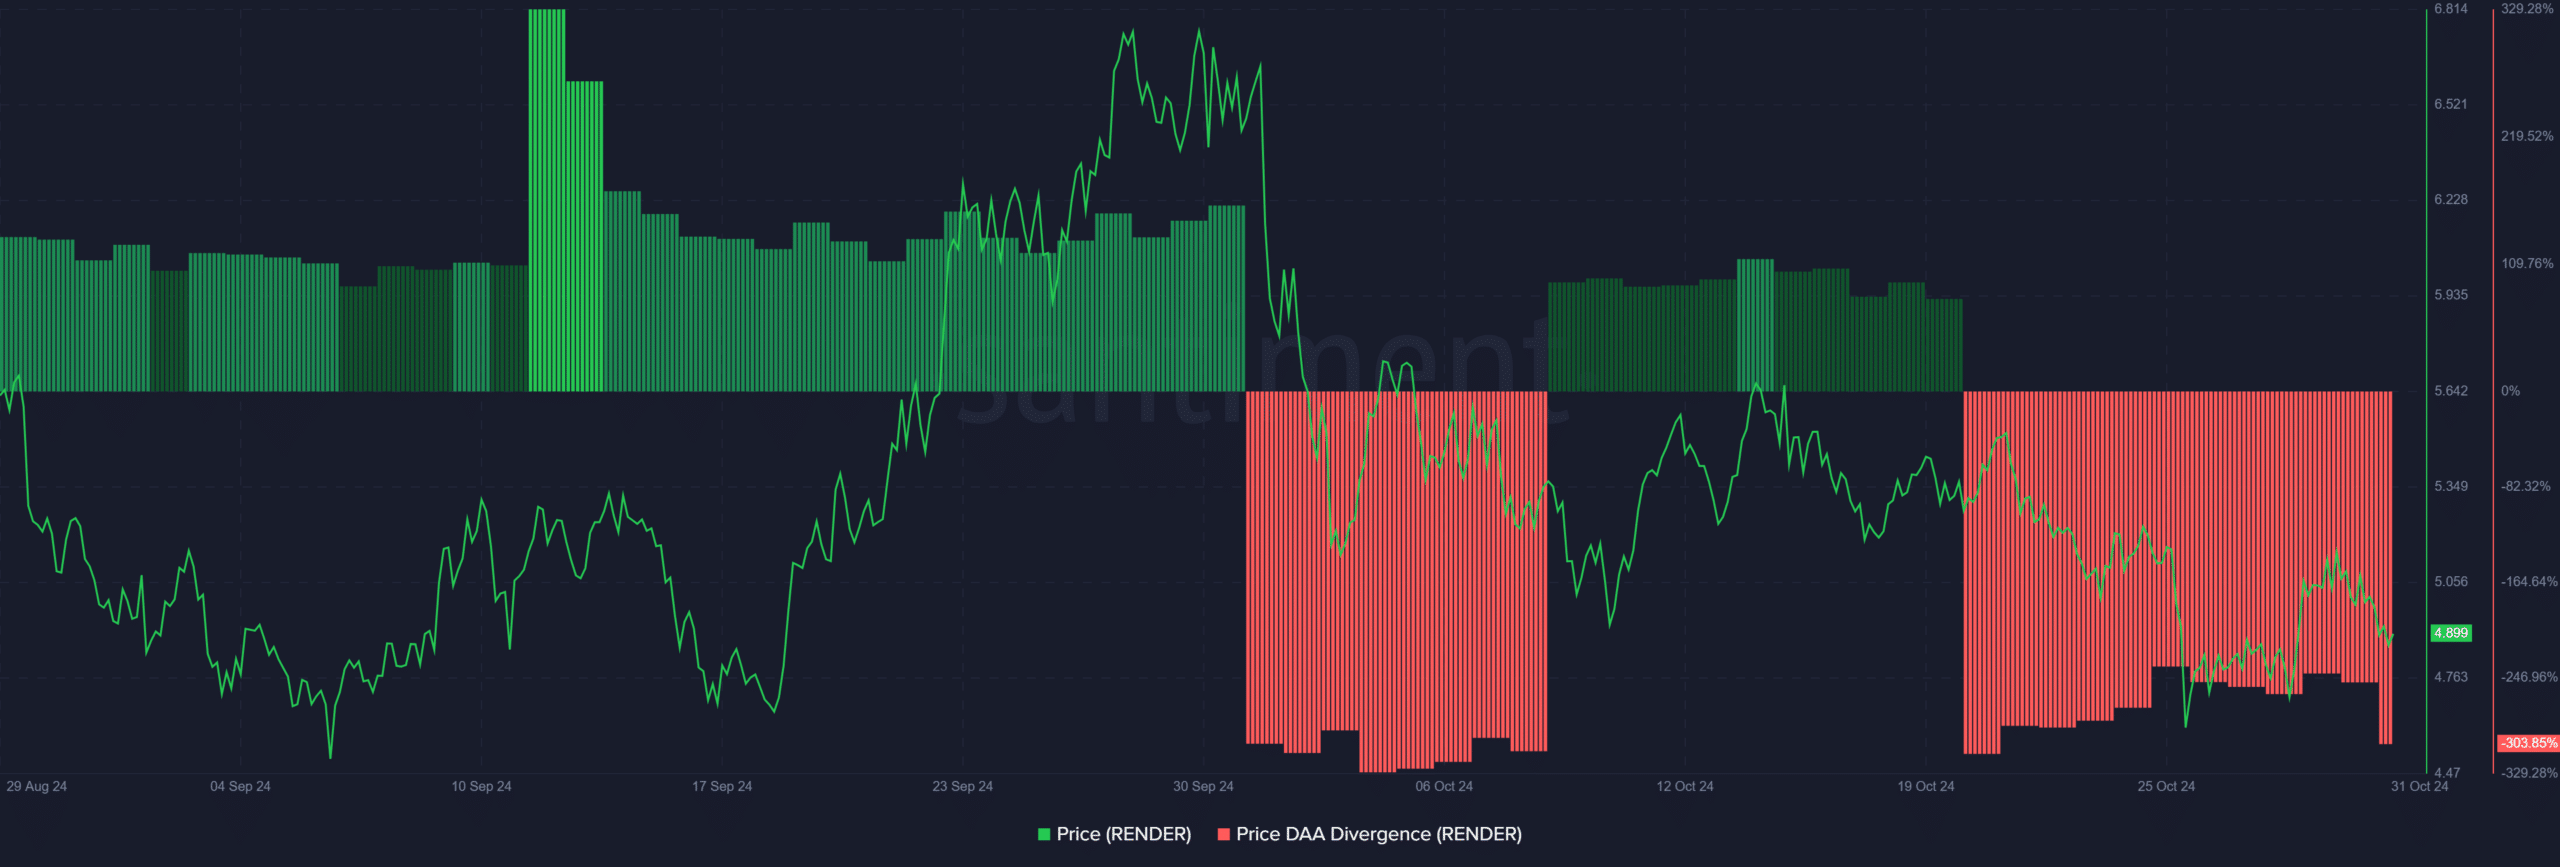
Source: Santiment
On-Chain Signals: What Can Metrics Tell Us?
Render’s on-chain metrics offer a cautious outlook. Net network growth, “financial” health, concentration, and large transactions all point to slightly bearish numbers.
For example, large trades show a -5.45% decline, indicating that whale activity is still limited.
However, RNDR’s significant daily trading volume could provide the liquidity needed to absorb selling pressure. As a result, changes in on-chain signals can change sentiment and open the door for upward momentum.
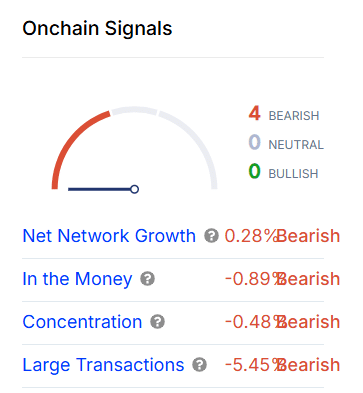
Source: IntoTheBlock
Liquidation: A look at long and short positions
Render’s liquidation data shows optimism among traders, with long positions reaching $49.97K compared to short positions of just $5.95. This bias towards buying reflects growing sentiment that a reversal could be imminent.
Additionally, with volume still high, traders can position themselves for a breakout. Therefore, this bull/short ratio is a signal that market participants expect upward pressure if the render can clear the resistance level.
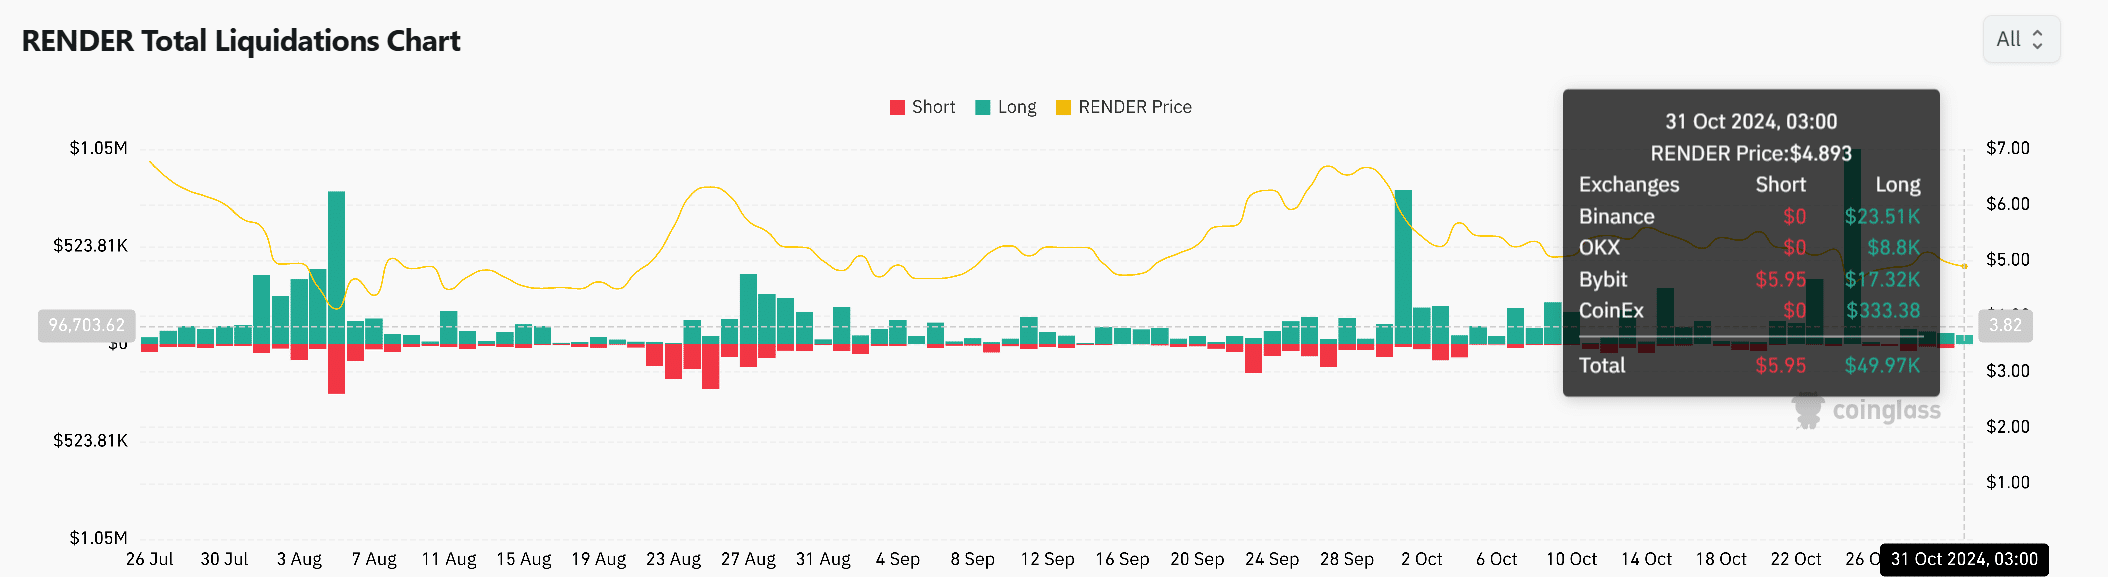
Source: Coinglass
Read Render (RNDR) Price Forecast for 2024-2025
In conclusion, Render’s technology and on-chain data point to a subtle but promising outlook. With strong market positioning and significant volume, RNDR could actually be poised for a reversal if it breaks key resistance levels and network activity strengthens.
Therefore, the stage appears to be set for RNDR to potentially break from its downward trend and lead the next wave of growth for DePIN.