Crypto Flexs
  • DIRECTORY
  • CRYPTO
    • ETHEREUM
    • BITCOIN
    • ALTCOIN
  • BLOCKCHAIN
  • EXCHANGE
  • TRADING
  • SUBMIT
Crypto Flexs
  • DIRECTORY
  • CRYPTO
    • ETHEREUM
    • BITCOIN
    • ALTCOIN
  • BLOCKCHAIN
  • EXCHANGE
  • TRADING
  • SUBMIT
Crypto Flexs
Home»ALTCOIN NEWS»Polkadot (DOT) traders can use this strategy to navigate downtrends in DOT.
ALTCOIN NEWS

Polkadot (DOT) traders can use this strategy to navigate downtrends in DOT.

By Crypto FlexsNovember 6, 20243 Mins Read
Facebook Twitter Pinterest LinkedIn Tumblr Email
Polkadot (DOT) traders can use this strategy to navigate downtrends in DOT.
Share
Facebook Twitter LinkedIn Pinterest Email
  • Polkadot continued its long-term decline and hovered around multi-year lows.
  • For DOT to restore its bullish outlook, it will need to find a decisive close above the 20-day and 50-day EMAs.

The recent price action of Polkadot (DOT) has revealed a steep bearish trend. The altcoin approached long-term support levels and returned to 2020 levels.

DOT is trading around $3.85 at press time, up nearly 2% in the last 24 hours. However, the overall trend remained weak. With continued selling pressure, will buyers be able to find the momentum to regain critical resistance levels?

DOT fights close to key support levels

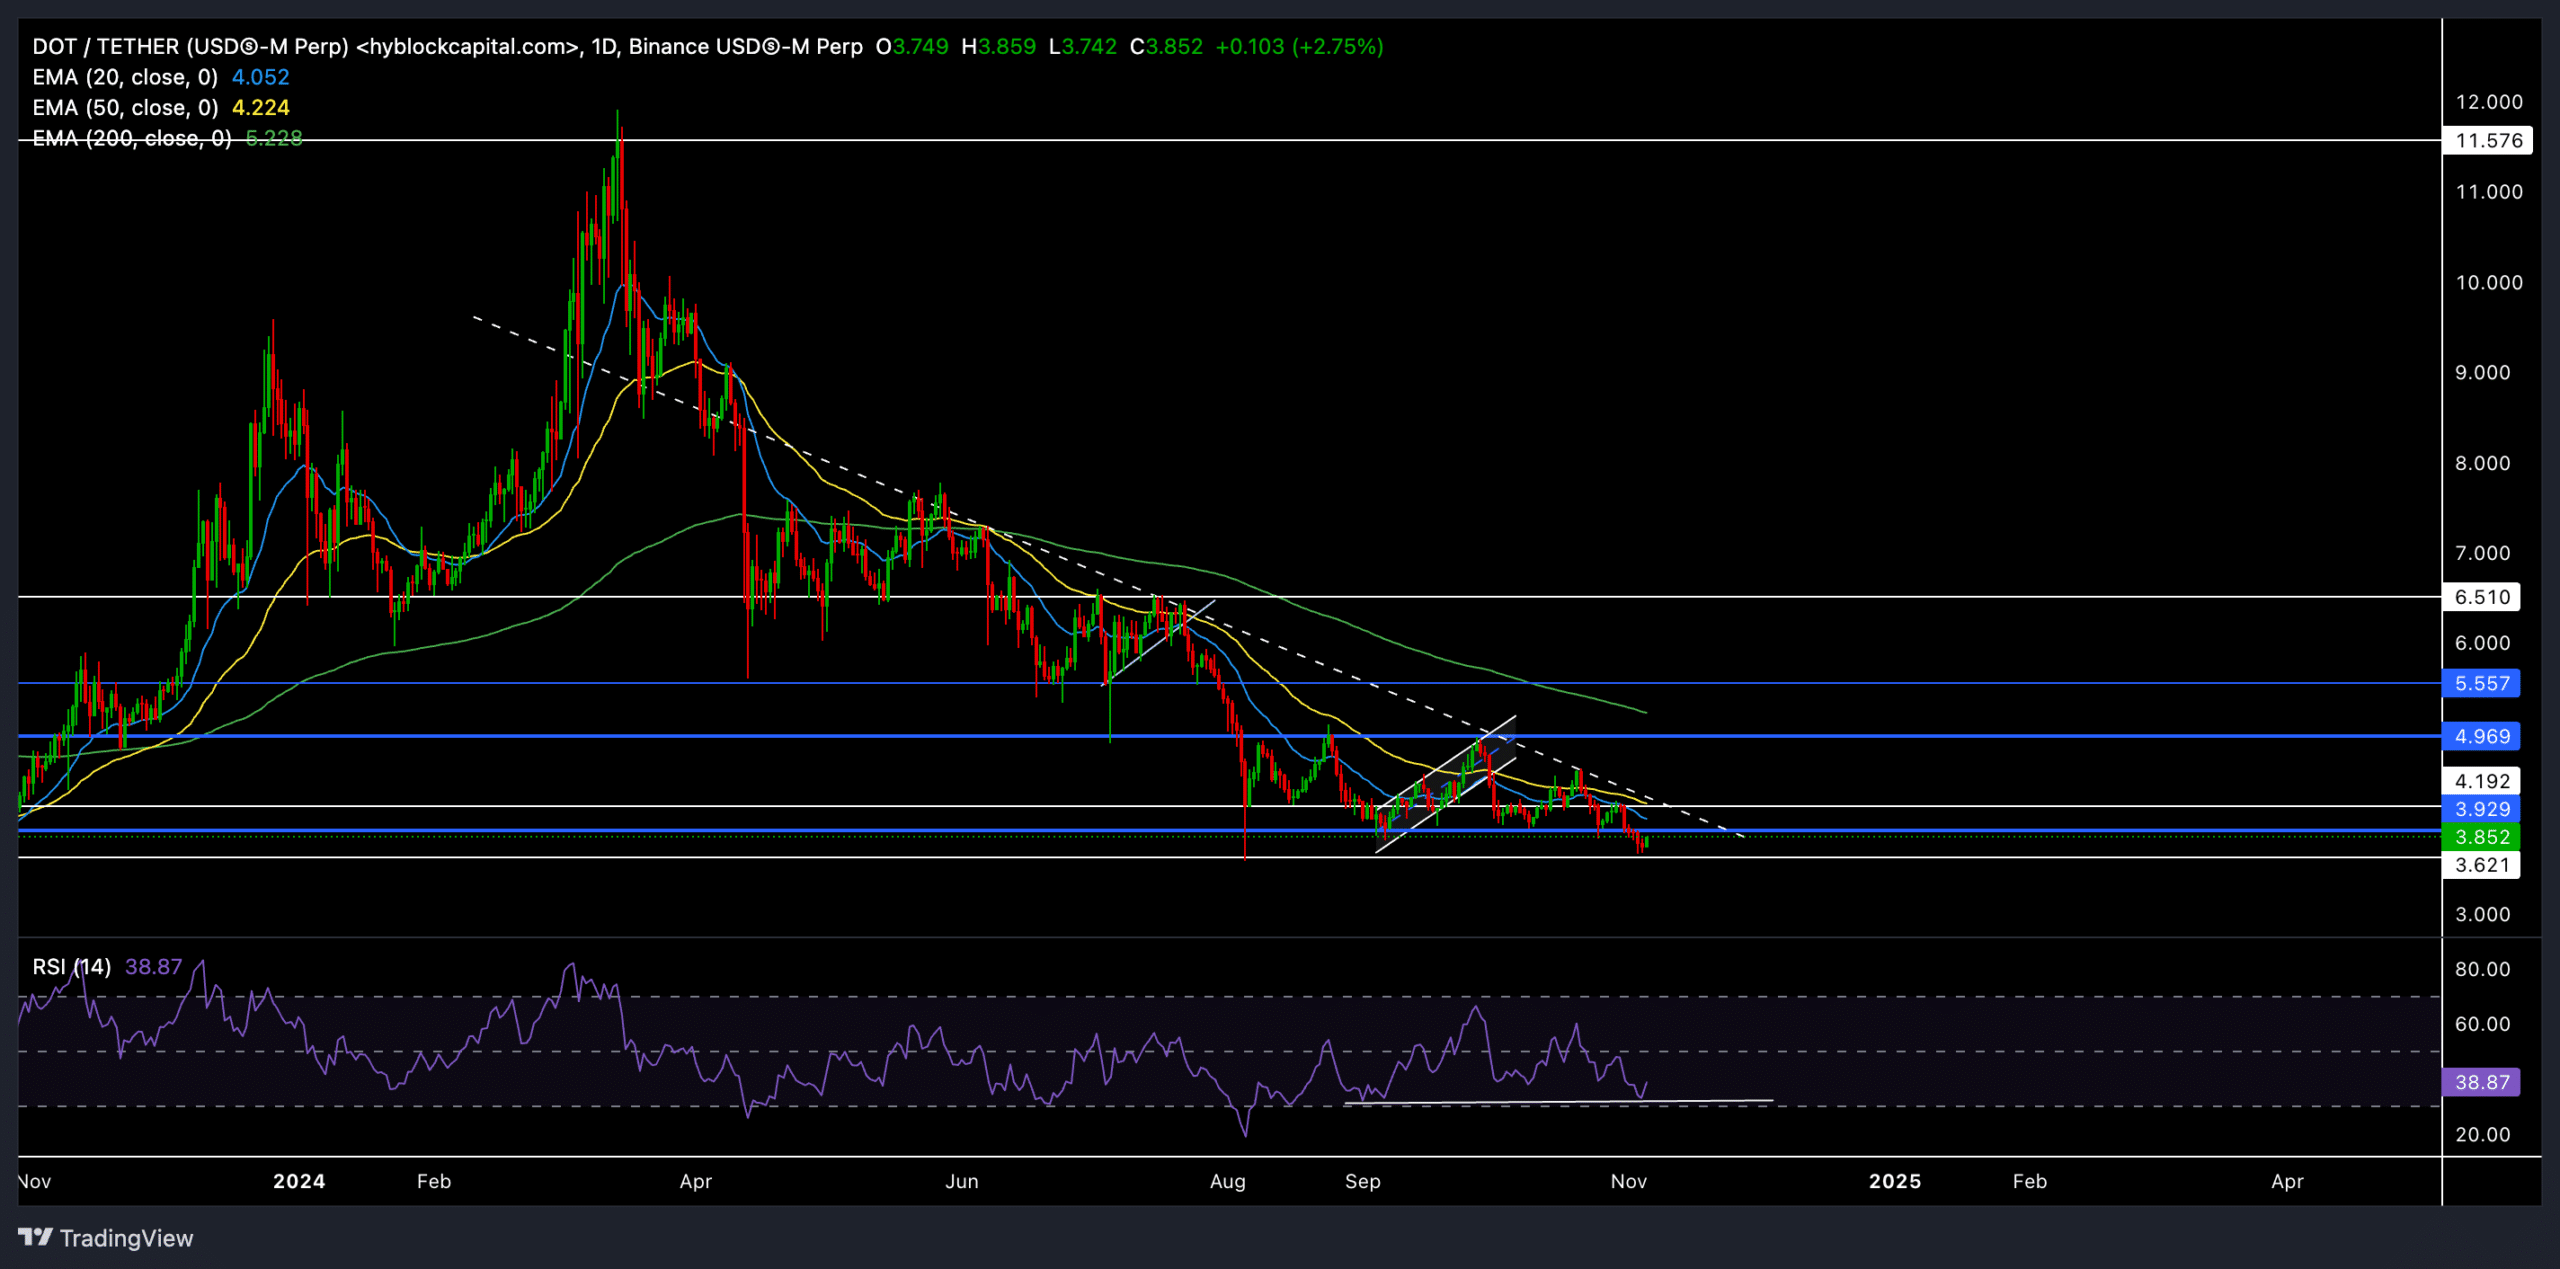
Source: TradingView, DOT/USDT

DOT has declined steeply over the past few months, consistently failing to break above the $4.9 resistance level. At the time of writing, the altcoin was trading well below the 20-day EMA ($4.05), 50-day EMA ($4.22), and 200-day EMA ($5.23).

Repeated rejection of these moving averages and the inability to break the 6-month trendline resistance (white, dotted line) have intensified selling pressure. Recently, DOT has fallen below the support level of $3.9 (currently resistance), putting it closer to multi-year lows of around $3.6. This is an important level to monitor.

DOT’s price movements suggested high volatility in the near future. If the altcoin can gather enough bullish momentum to break above the $3.9 resistance level again, it could test the 20/50-day EMA. Recovering these EMAs is critical for buyers to take advantage in the near term and could potentially open the path to a test of higher resistance at $4.9.

However, the bearish outlook remained strong due to the overall downtrend. A break below the crucial $3.6 support could accelerate the decline and force DOT to explore new lows.

Also, at the time of writing, RSI is at 40. It is worth noting here that recent higher lows in RSI suggest a bullish divergence from lower lows in price action.

Key levels to note

apply: The immediate support level was confirmed to be $3.6. This is a multi-year low that is psychologically very important. A drop below this could lead to further declines.

resistance: The first resistance level was $3.9, followed by the 20-day EMA at $4.05 and the 50-day EMA at $4.22. A decisive move above these levels could provide DOT buyers with an opportunity to regain control of the market.

What is disclosed in derivatives data

Source: Coinglass

Derivatives data revealed mixed feelings among DOT traders. The 24-hour long/short ratio was 0.9029, showing a slight preference for short positions and traders showing some caution. However, the long/short ratios of Binance and OKX were quite optimistic. Binance recorded 4.7013 and OKX recorded 3.58. This is a sign that traders on these platforms are hopeful about a recovery.

Traders should closely monitor broader market trends, especially Bitcoin’s movements.

Next: How Could Phantom’s Increased Long Position Power Its Next Big Leap?

Share. Facebook Twitter Pinterest LinkedIn Tumblr Email

Related Posts

Strategy adds 592 BTC to milestone purchases

February 26, 2026

Institutional investors sold $3.74 billion in Bitcoin and cryptocurrencies in just one month as BTC price craters: CoinShares

February 19, 2026

Why the on-chain AI agent economy hasn’t taken off yet

February 12, 2026
Add A Comment

Comments are closed.

Recent Posts

Threshold Launches All-in-One Bitcoin Liquidity App

March 3, 2026

Digital Casinos In The Age Of Crypto

March 3, 2026

Ethereum Price Prediction: Bearish Technicals Keep $ETH Under Pressure Near $2,700.

March 3, 2026

Paradex Signals Upcoming $DIME Token Generation Event

March 3, 2026

Bitcoin rose amid Iranian volatility as IBIT recorded one of the biggest inflow days of the quarter.

March 3, 2026

Are Investors Abandoning BTC?

March 2, 2026

Trident Arena Announcement – Ackee Blockchain

March 2, 2026

SHIB Price Prediction: SHIB Leader Drops Secret Profile Update — Is Something Big Coming?

March 2, 2026

Bitmine Immersion Technologies (BMNR) Announces ETH Holdings Reach 4.474 Million Tokens, And Total Crypto And Total Cash Holdings Of $9.9 Billion

March 2, 2026

European bank secures exchange partners for stablecoin launch in 2026

March 2, 2026

Market Instability Doesn’t Mean You Can’t Make Money

March 2, 2026

Crypto Flexs is a Professional Cryptocurrency News Platform. Here we will provide you only interesting content, which you will like very much. We’re dedicated to providing you the best of Cryptocurrency. We hope you enjoy our Cryptocurrency News as much as we enjoy offering them to you.

Contact Us : Partner(@)Cryptoflexs.com

Top Insights

Threshold Launches All-in-One Bitcoin Liquidity App

March 3, 2026

Digital Casinos In The Age Of Crypto

March 3, 2026

Ethereum Price Prediction: Bearish Technicals Keep $ETH Under Pressure Near $2,700.

March 3, 2026
Most Popular

Start Passive Crypto Income At Zero Cost

October 21, 2025

Crypto Investors Are Falling Into a Trap: Analyst

December 1, 2023

Ether Lee is seeing a one -day inflow of 449K ETH from the accumulation address.

April 25, 2025
  • Home
  • About Us
  • Contact Us
  • Disclaimer
  • Privacy Policy
  • Terms and Conditions
© 2026 Crypto Flexs

Type above and press Enter to search. Press Esc to cancel.