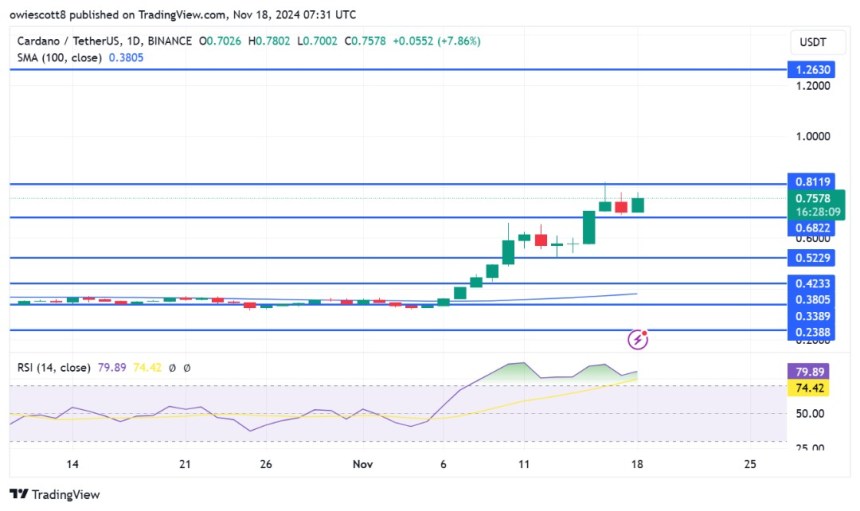
Cardano (ADA) is in the spotlight as a strong bullish bounce from the $0.6822 support level has reignited traders’ optimism. This comeback could be a turning point for ADA, with renewed momentum pushing the price higher and signaling the resumption of the uptrend. Market sentiment appears to be shifting to the bullish side as buying interest increases, raising questions about this. How high can Cardano rise in the next few days? All eyes are now on key resistance levels as ADA’s rally gains strength, raising hopes for continued growth.
The goal of this analysis is to examine Cardano’s recent bounce from the $0.6822 support level and its impact on the asset’s future trajectory. By examining key technical indicators, market sentiment, and potential resistance levels, this article attempts to assess whether ADA’s momentum can sustain its upward trend or if it may face challenges along the way.
Shifting market sentiment: Are the bulls back in control?
Currently, ADA is showing new positive strength after rebounding from the $0.6822 support level and is steadily advancing towards the $0.8119 resistance level. This recovery signals a significant shift in sentiment as buying pressure triggers further price gains. Notably, Cardano is trading above the 100-day simple moving average (SMA) on the 4-hour chart. This not only strengthens the bullish trend but also provides a strong foundation for further upside if ADA successfully breaks the $0.8119 resistance level.
Examining the 4-hour Relative Strength Index (RSI), we found that the RSI fell to 57% and is trying to rise back above the 70% threshold. This signals a resurgence of buying pressure, reflecting new bullish momentum in the market. A break above the 70% level indicates strong overbought conditions, suggesting solid demand and the potential for further price rises.
Additionally, the daily chart shows strong upward movement, with ADA recovering from the $0.6822 level and forming a bullish candle. Trading above the important 100-day SMA strengthens the positive trend, indicating continued strength. As Cardano continues to rise, it strengthens market confidence and sets the stage for growth.

Additionally, the RSI on the daily chart is currently at 80%, hovering above the 50% threshold, indicating strong optimism. This surge indicates the return of buying pressure after a brief decline to 60%. A high RSI means the asset is overbought, but it also indicates continued strength, indicating upside potential.
What’s next for Cardano: Can the rally maintain its pace?
ADA showed strong bullish momentum after bouncing off the support at $0.6822 and advancing towards the key resistance at $0.8119. The ability to stay above the 100-day SMA on the 4-hour chart suggests continued strength and indicates that Cardano can maintain its uptrend. A successful break above the $0.8119 resistance could push the price up to the $1.26 resistance, setting the stage for a price surge.
However, if the rally struggles to break the $0.8119 resistance level, a pullback or consolidation could occur, shifting focus to key support levels.

