

![]()
contributor
Posted on:
- Render’s breakout from the bullish flag pattern signaled a possible rally to $14.
- Increased network activity and liquidation of short positions signaled the potential for continued price rises.
Render (RNDR) received a lot of attention in the market after breaking a bullish flag pattern, with its price surging 8.71% to $8.14 as of press time.
The breakthrough comes after the token achieved a market cap of $4 billion, sparking interest from investors and traders.
With major resistance at $10 and a potential target at $14, Render’s next price move could have significant implications for its future.
But can Render maintain its upward momentum, or is a price decline imminent?
What drives price action?
Render’s bullish breakout is a clear sign of increased investor confidence.
A breakout of the bullish flag pattern sets the stage for a potential bounce towards the $10 resistance level, a key hurdle that could determine the next stage of price action.
If the render breaks above this level, traders could target $14 as the next price target, potentially marking a 70% upside from current levels.
Additionally, the token’s recent market cap of $4 billion indicates growing interest in the Render ecosystem. These milestones often attract more investors and can provide a solid foundation for further price appreciation.
Render’s technical indicators provide additional insight into price action. The relative strength index (RSI) was 59.28 at press time.
This suggests that the token is approaching overbought conditions while remaining in bullish territory. Therefore, while RNDR may continue to rise, the risk of a price correction increases as the token approaches overbought levels.
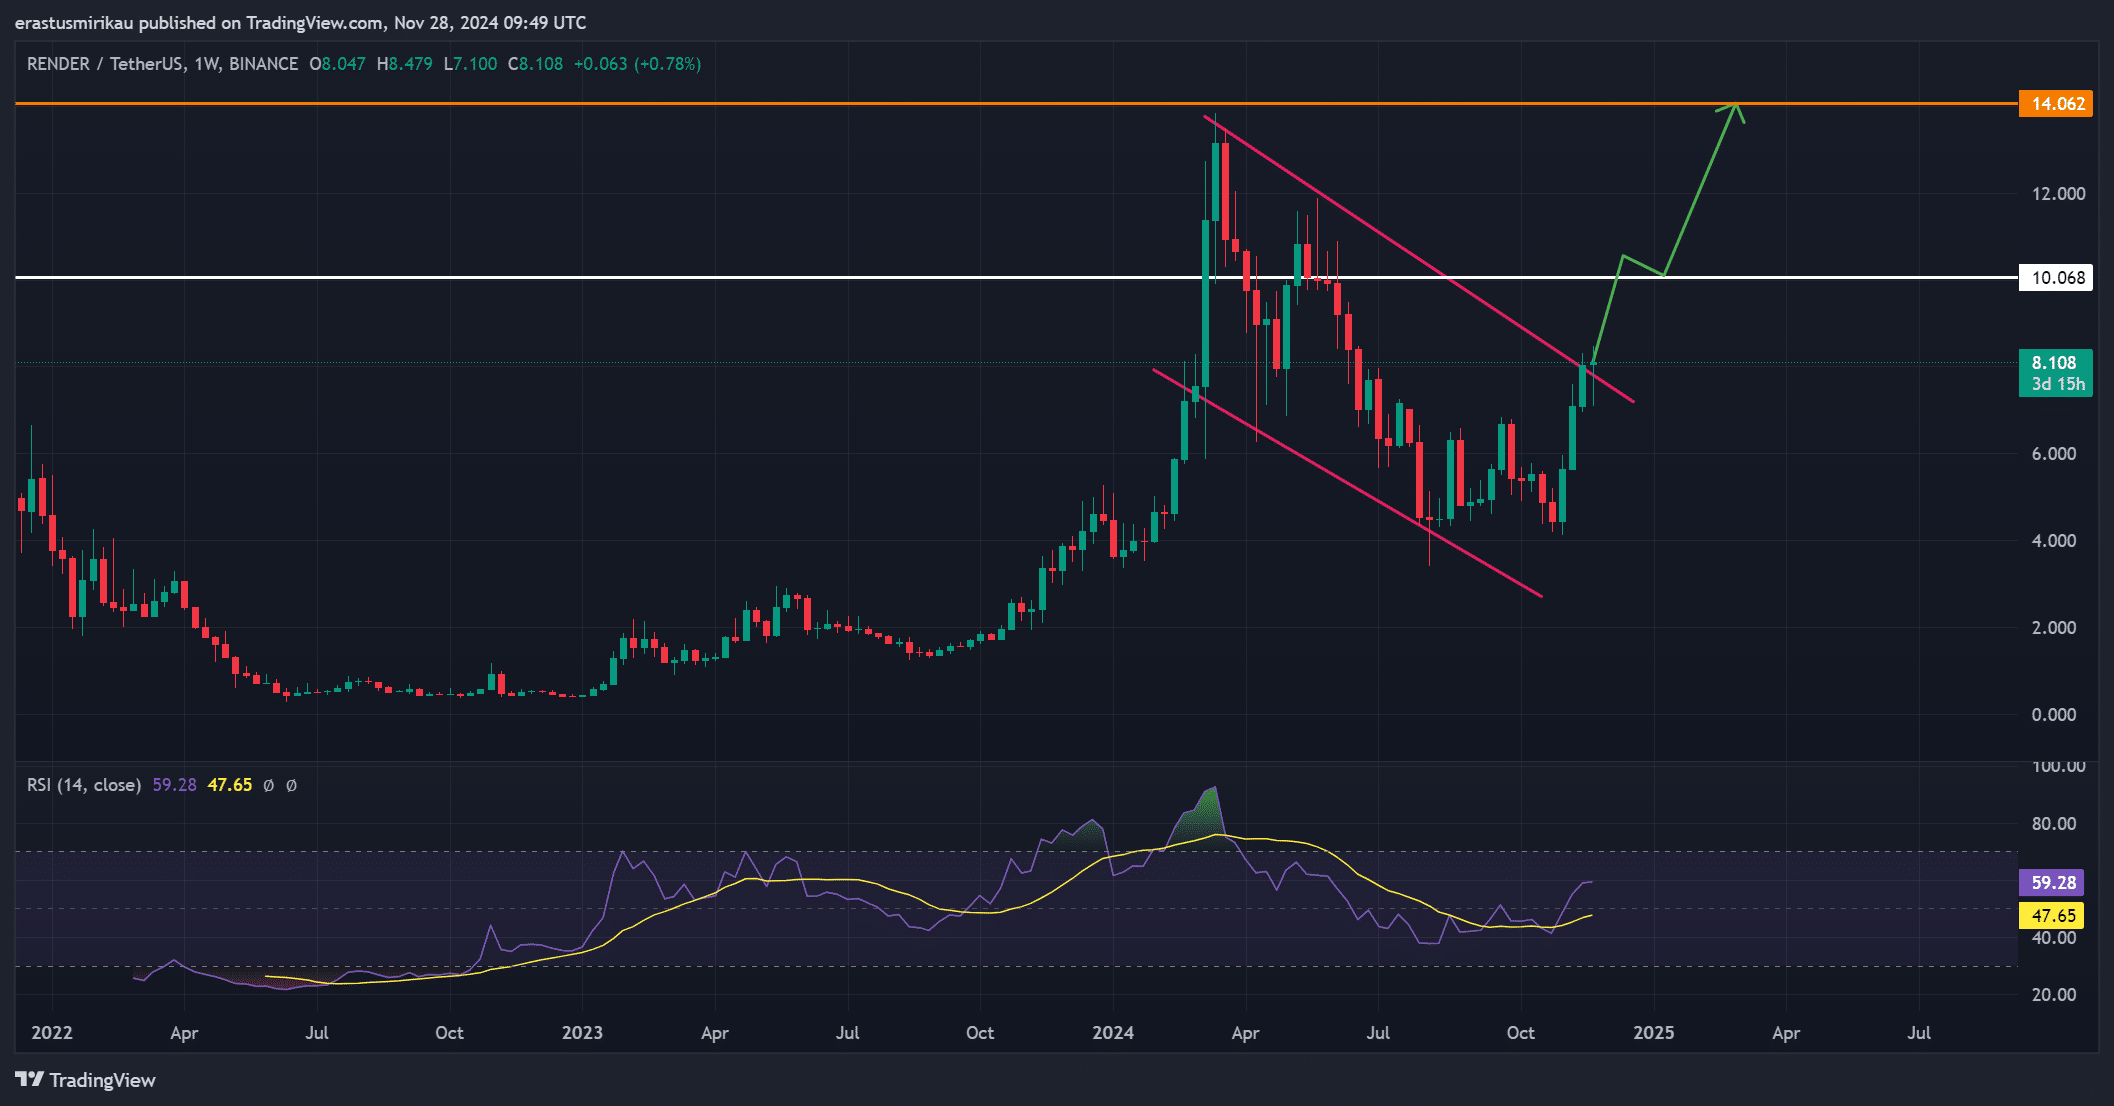
Source: TradingView
What does the data show?
RNDR’s network activity is also showing positive signs. The number of daily active addresses increased from 609 the previous day to 894.
This rise indicates that more users are actively participating in the network, which could signal increased demand and further support the current price increase.
Higher network activity usually increases trading volume and adds bullish momentum.
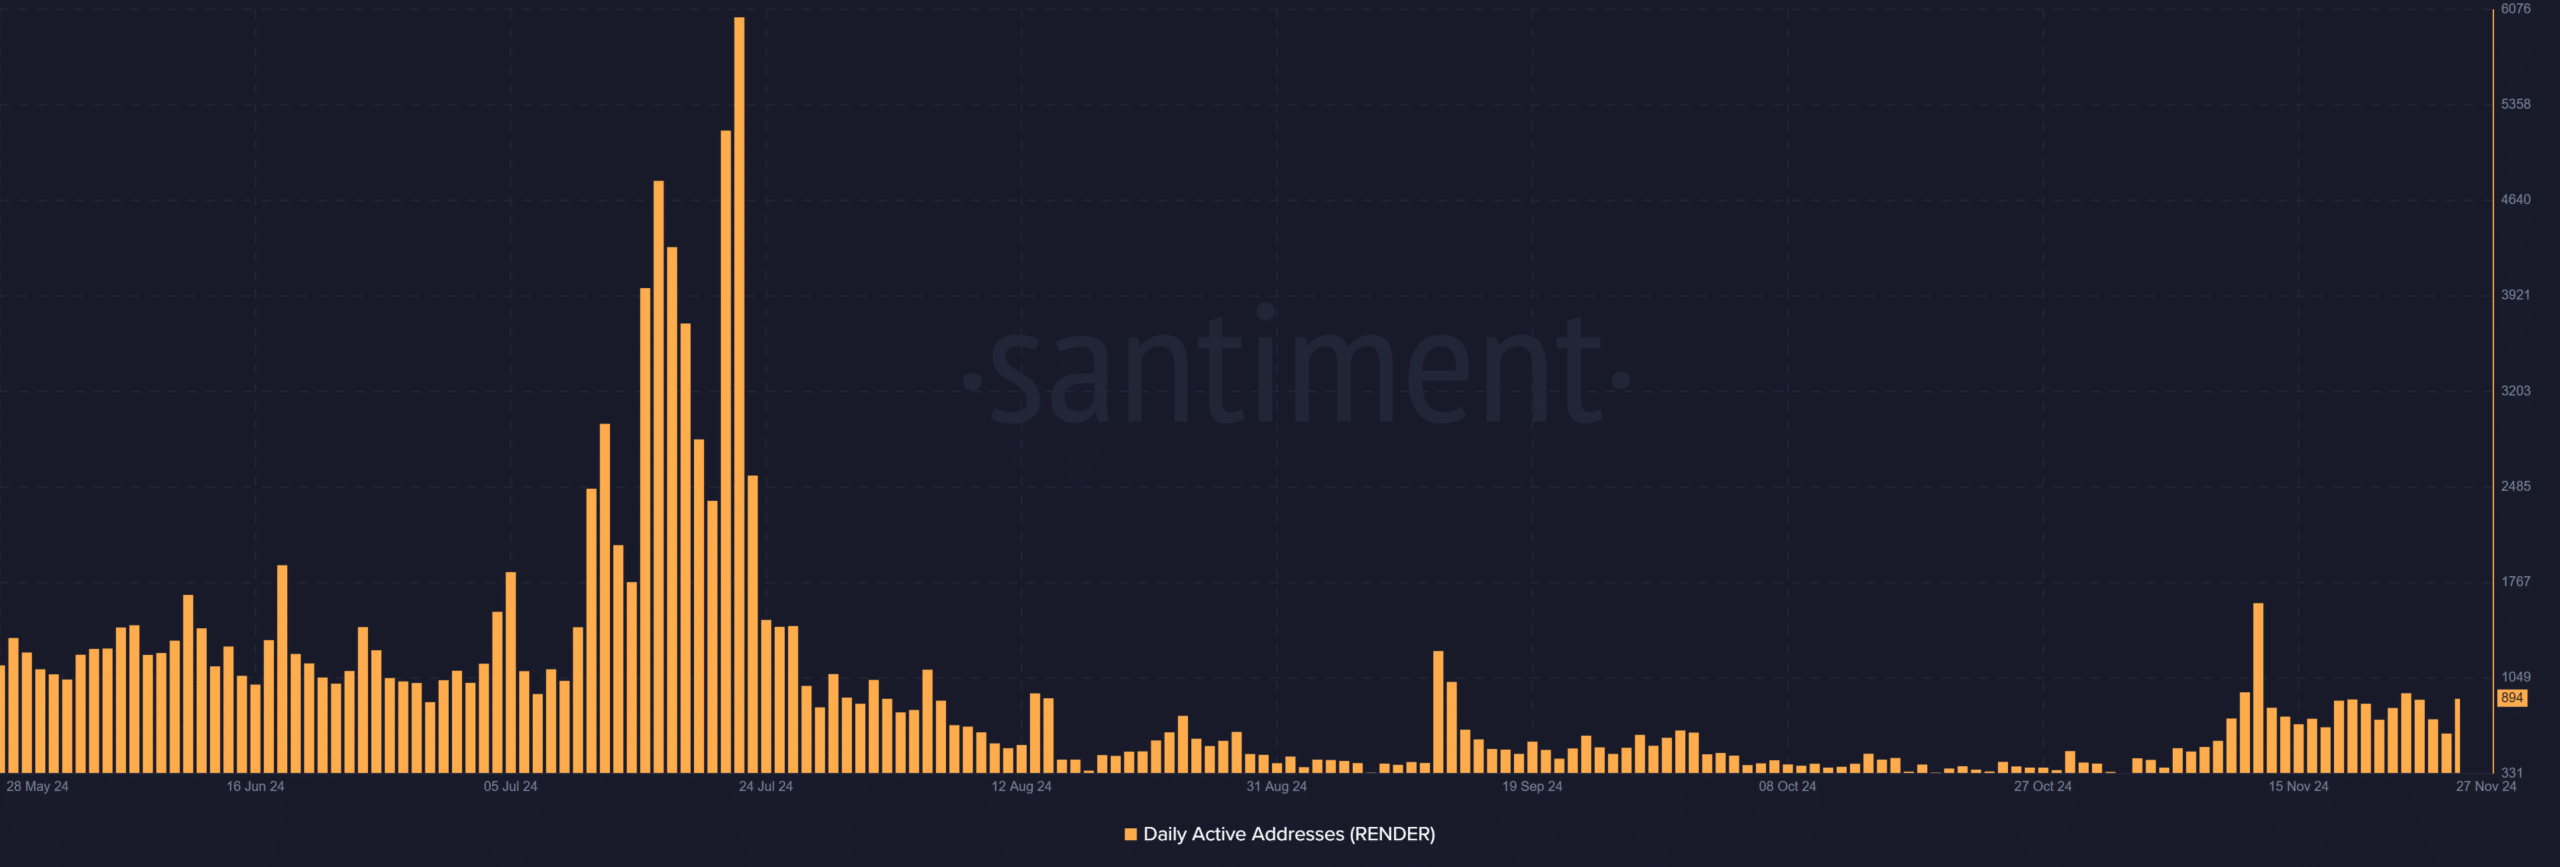
Source: Santiment
Liquidation and Market Pressure
Render’s market dynamics showed that both long-term and short-term traders were feeling the pressure. Short liquidations totaled $114.76K and long liquidations totaled $53.85K.
High sell liquidation volume is a sign that traders betting on RNDR are facing increasing losses, which could trigger further price action.
As a result, short sellers may be forced to maintain their positions, contributing to bullish momentum.
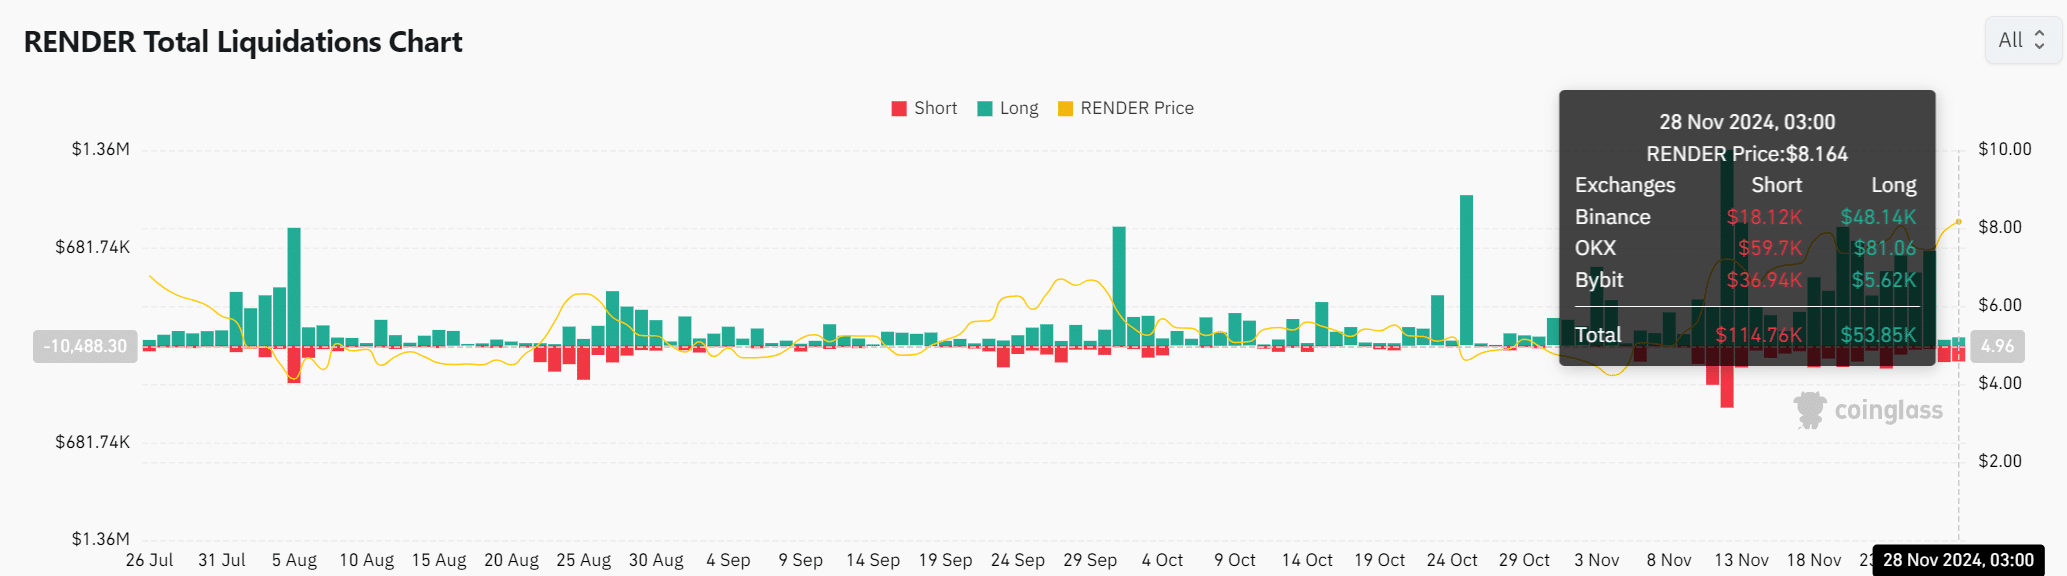
Source: Coinglass
Read Render (RNDR) Price Forecast for 2024-2025
Conclusion: Will RNDR reach $14?
Render’s breakthrough combined with an increase in active addresses and optimistic market sentiment sets a positive outlook for the token.
However, RSI is approaching overbought territory and major resistance at $10 could challenge that momentum. A rally to $14 is certainly possible if Render clears the $10 resistance.