join us telegram A channel to stay up to date on breaking news coverage
Hedera price prediction shows that HBAR is in a bullish trend. It faces a significant resistance area at $0.27, with a breakout dependent on increased volume and market momentum.
Hedera Forecast Statistics Data:
- Current Hedera price – $0.23
- Hedera market cap – $9.32 trillion
- Hedera Circulation Volume – 38.2 billion
- Hedera total supply – 50 billion
- Hedera CoinMarketCap Ranking – 19th
For cryptocurrency projects, it is often recommended to highlight important price milestones as soon as possible. Looking at Hedera’s (HBAR) performance, we can see impressive growth since its all-time low of $0.01001 in January 2020, when it increased by over 2300%. Since then, the token has experienced significant volatility, with the recent 24-hour price range showing a low of $0.1893 and a high of $0.2567. Despite reaching an all-time high of $0.5701 in September 2021, the price has since fallen nearly 57%, but its journey from the beginning shows incredible growth potential.
HBAR/USD Market
Main level:
Resistance levels: $0.35, $0.37, $0.39
Support levels: $0.10, $0.08, $0.06
Analyzing HBAR/USD, recent price action reflects a strong bullish trend, showing significant upward momentum. At the start of the rally, HBAR found strong support from trend bands, which have historically provided reliable guidance on price trajectory. After a brief consolidation phase between $0.15 and the trend band last week, the cryptocurrency broke through this range and started gaining upward momentum, highlighting the fundamental strength of the market structure.
Hedera Price Prediction: What’s next for Hedera (HBAR)?
The daily chart indicates a bullish trajectory for Hedera (HBAR), with the price close to the critical resistance area between $0.25 and $0.27. A move beyond this area could see HBAR rise into the $0.30-$0.32 range. However, overcoming this hurdle would require a significant increase in trading volume and market participation, with daily trading volume potentially exceeding $2 billion, as seen in past rallies. Absent such momentum, HBAR could consolidate near the resistance zone, setting the stage for a stronger move in favorable market conditions.
Nonetheless, the daily trend remains bullish and potential resistance levels include $0.35, $0.37, and $0.39 if the price breaks above the current channel. Conversely, a bearish turn could result in price testing support levels at $0.10, $0.08, and $0.06, which correspond to the lower bounds of the channel. Traders should closely monitor trading volume and market sentiment to gauge the likelihood of a decisive breakout or consolidation.
HBAR/BTC could gain more upside
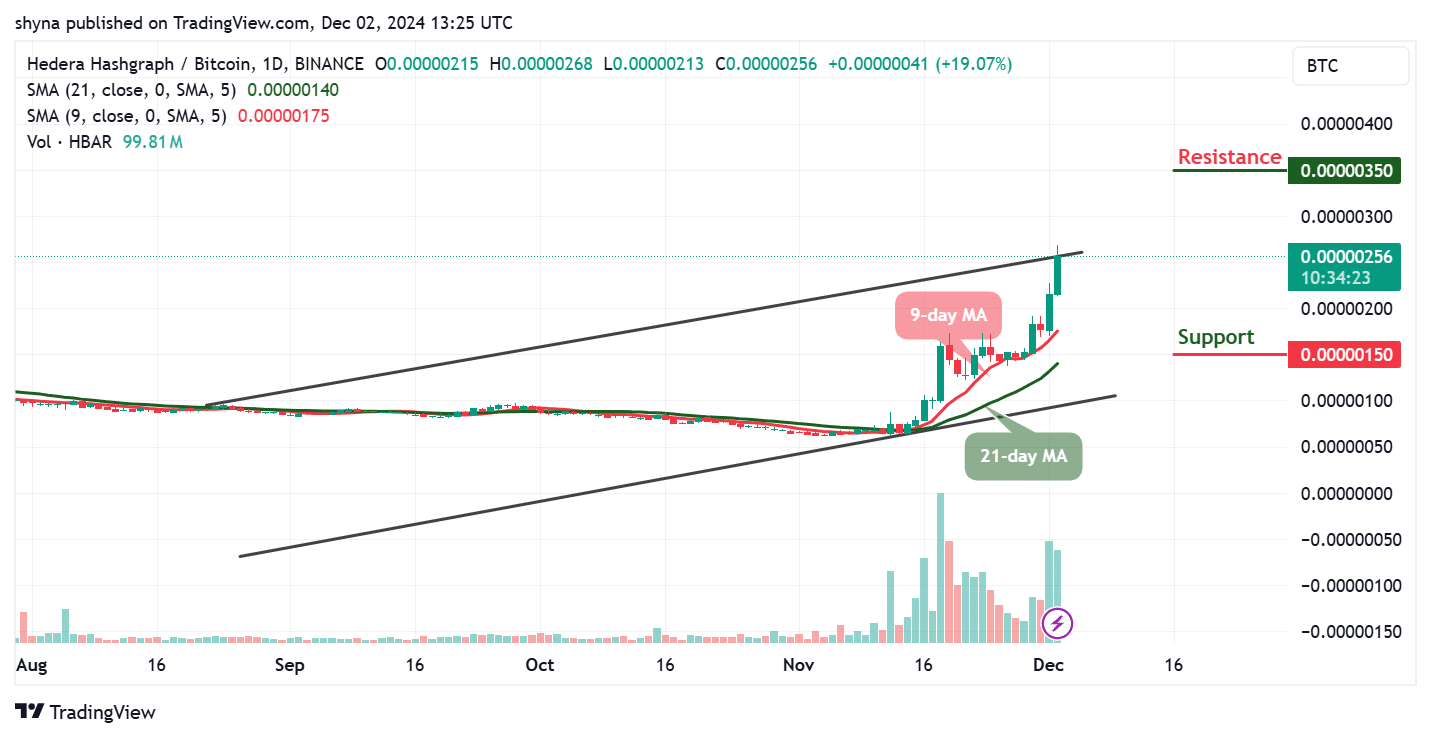
The daily chart of Hedera Hashgraph (HBAR) against Bitcoin (BTC) shows strong bullish momentum, with the current price sitting at 256 SAT, reflecting a 19.07% rise. The 9-day moving average (MA) bullishly crossing the 21-day MA highlights short-term upward momentum. The recent breakout has strengthened as volume has increased, pushing the price towards the upper boundary of the rising channel. The focus is on the key resistance at 350 SAT, with a potential break above this level paving the way for further upward movement.


Meanwhile, support at 150 SAT serves as a solid base on the downside, but the overall trend remains healthy, as evidenced by the formation of higher highs and higher lows. The optimistic outlook is supported by the widening gap between moving averages. To maintain this momentum, we need to maintain high volume and stay above the 9-day MA. If this trend continues, HBAR could challenge the upper boundary of the channel and cross the 300 SAT resistance, solidifying a bullish trajectory for Bitcoin.
On that note, @dudebruhwhoa shared an update with his followers on X (formerly Twitter), highlighting that $HBAR closed the week above the outer yellow channel on the long-term parallel channel chart. He reminded everyone that if $HBAR breaks above the monthly resistance, especially the parallel resistance, the price target could rise further.
$hbar It closed the week above the outer yellow channel on the previous long-term parallel channel chart. Exceeding monthly resistance is a reminder that your target may go higher, especially if it exceeds parallel resistance. pic.twitter.com/F1yXYRPlEL
– wĦoabruℏdudebruℏ (@dudebruhwhoa) December 2, 2024
ivy alternative
HBAR’s technical outlook remains positive, driven by increased trading volume and solid market fundamentals. However, key resistance levels and their relationship to Bitcoin dominance suggest caution is needed. While a breakout is imminent, a sustained upward trend will depend on increasing market participation and investor confidence. At the same time, Pepe Unchained is gaining significant traction in the meme coin space, having raised over $64 million, with daily inflows exceeding $1.5 million. The token’s expansion is fueled by layer 2 blockchain features, including a decentralized exchange (DEX), staking rewards, and a “Pepe pump pad” that allows users to easily generate meme coins.
New PEPE Coin Replacement PEPE UNCHAINED Coming Soon
With strong growth potential, the $PEPU token could generate 10x to 100x profits if listed on major exchanges such as Binance and Coinbase. As demand continues to surge and the token becomes more widely accessible, now is the perfect time to invest in Pepe Unchained for significant future returns.
Visit Pepe Unchained
Related news
Most Searched Cryptocurrency Launch – Pepe Unchained
- Layer 2 Meme Coin Ecosystem
- Cointelegraph Special
- Thanks to SolidProof and Coinsult
- Staking Rewards – pepeunchained.com
- ICO raised over $40 million – end of December
join us telegram A channel to stay up to date on breaking news coverage

