

- POL appears to have formed a bullish flag on the 4-hour chart, suggesting an upward trend ahead.
- Considering that the majority of holders are yet to make a profit, this upward trend may face resistance.
Polygon (POL) It was trading at $0.655 at press time after rising 11% in 24 hours. This rise is a reversal of the bearish trend, considering the price has remained down 7% over the past seven days.
Like most altcoins, Polygon had a strong rally in late November before hitting a snag early this month. This uptrend and subsequent downtrend formed a bullish flag on POL’s 4-hour chart.
This pattern indicates that POL can continue its upward trend, but more buying volume is needed to support a breakout.
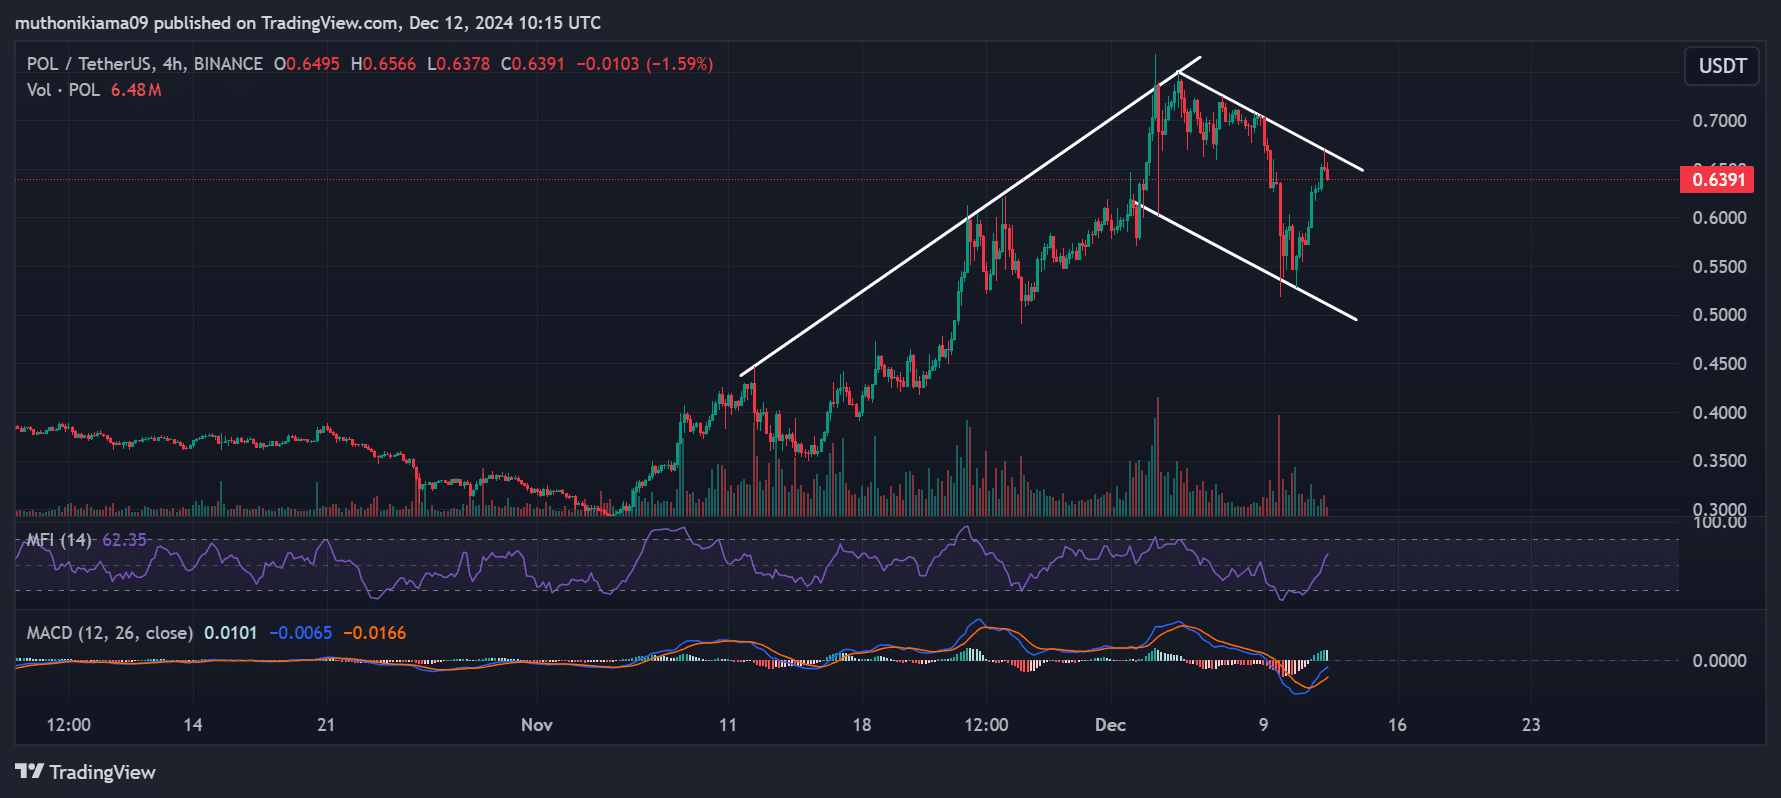
Source: TradingView
Volume histogram bars indicate minimal buying and selling activity. However, the Money Flow Index (MFI) index rose to 62 after rising, indicating increasing purchasing activity.
Moving Average Convergence Divergence (MACD) also shows that the bulls are regaining control after the MACD histogram bar reversed to green, indicating increased buying activity.
At the same time, the MACD line on this sub-timeframe is in an upward trend, and if it crosses above the signal line, it confirms short-term strength.
Key levels to note
IntoTheBlock’s In/Out of the Money Around Price (IOMAP) indicator shows that nearly 10,000 addresses purchased POL between $0.65 and $0.67. This price range can act as a support level, below which a recession could occur.
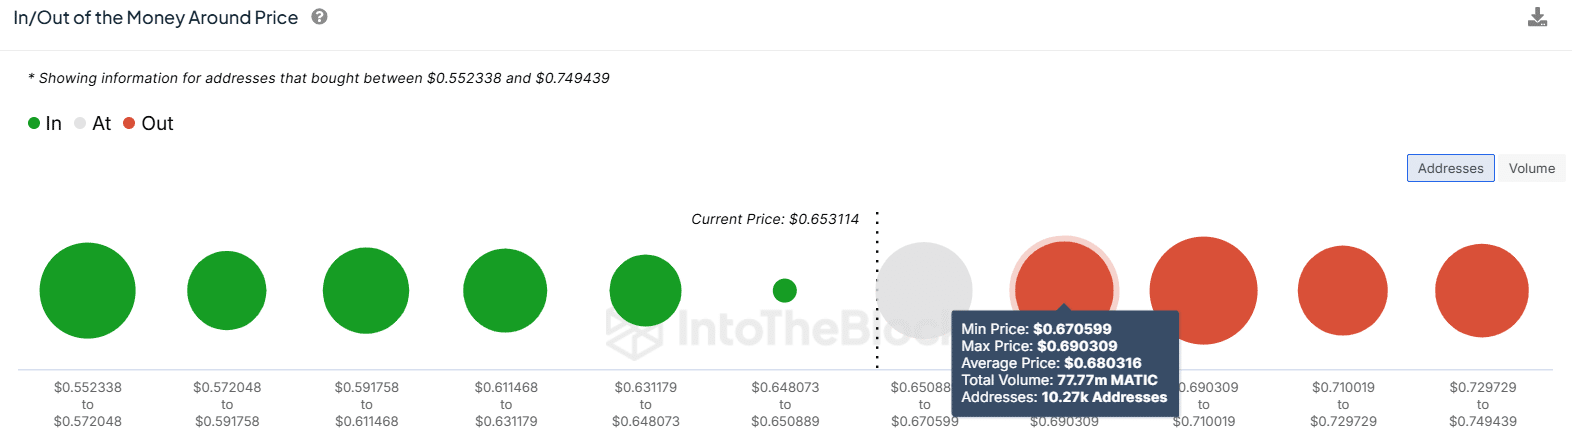
Source: IntoTheBlock
Another group to watch is 10,270 addresses that purchased over 31 million POL tokens between $0.67 and $0.69. This zone can act as a strong resistance level as these addresses can start selling once they become profitable.
Polygon’s dApp activity may affect price
Data from DappRadar shows that Polygon’s seven-day dApp trading volume was down more than 8% to $2.41 billion at press time. Unique Active Wallets (UAW) also decreased by 10%.
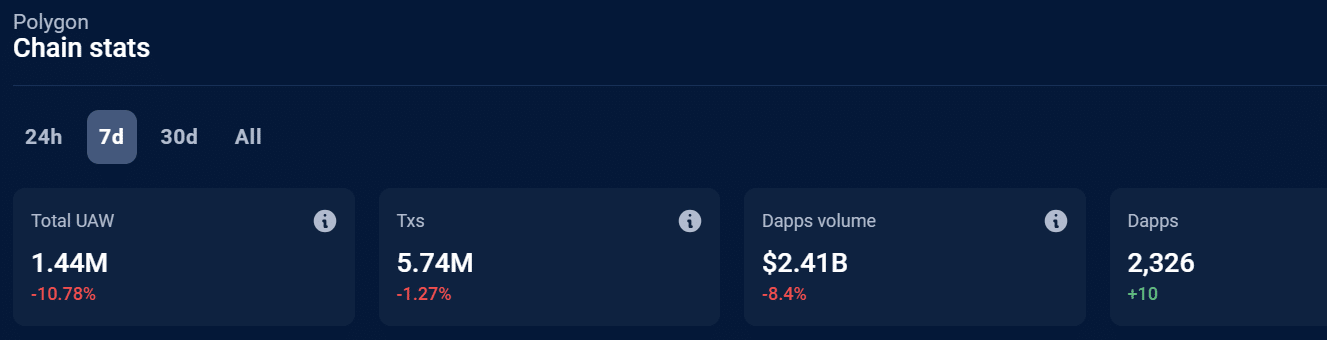
Source: DappRadar
However, on the decentralized finance (DeFi) side, Polygon saw a strong recovery, with total value locked (TVL) surging to $1.195 billion. DeFiLlama. TVL is now at its highest level in over a month.
If the Polygon network continues to show strength and growth, it could bode well for POL.
Is your portfolio green? Check out our POL Profit Calculator
Long/Short Ratio Shows Sentiment Shifts
Polygon’s long/short ratio fell to a monthly low of 0.79 on December 9 after increased short selling activity. However, this ratio later surged to 0.90.
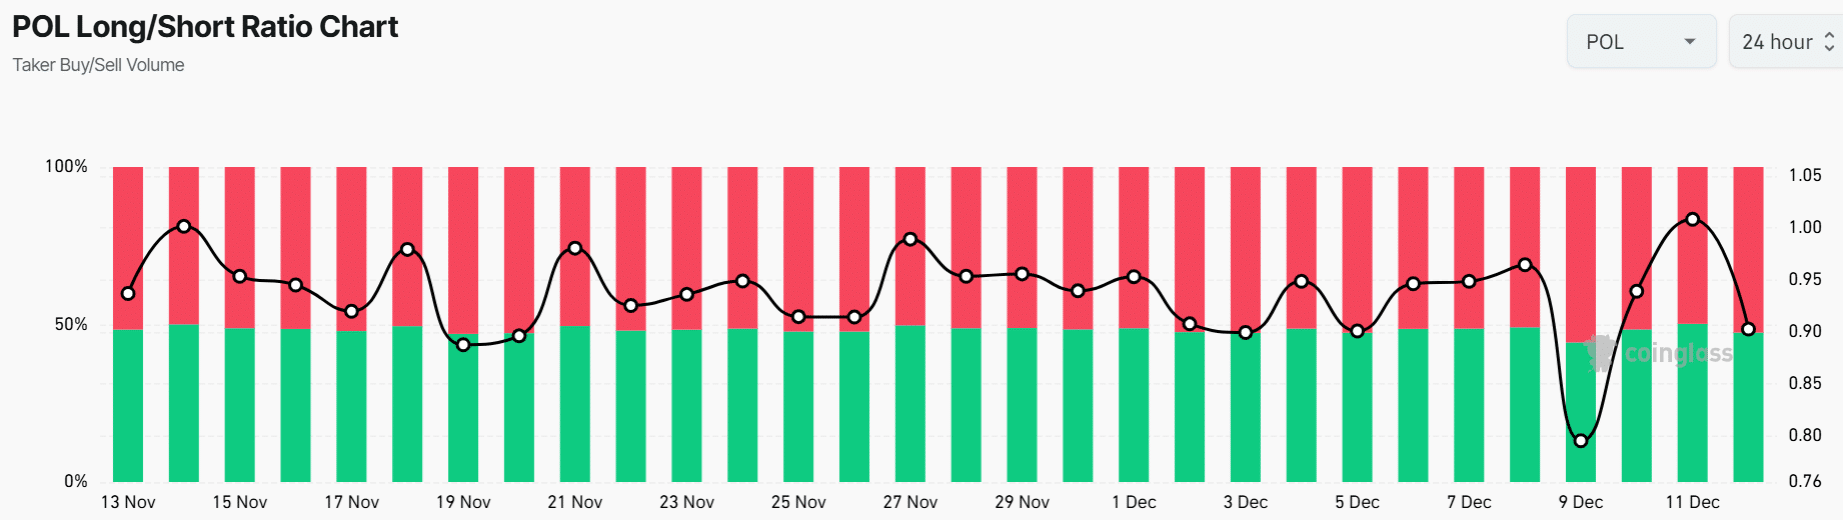
Source: Coinglass
POL’s long/short ratio still shows bearish sentiment, considering that 52% of traders are short sellers. This means that fewer traders are optimistic about a continued uptrend.