Highlights
- The historical price pattern is marked by the longest streak of green hourly candles in seven years, indicating a possible trend reversal ahead.
- Market indicators show mixed signals with RSI suggesting a seller advantage at 46.73 while whale accumulation suggests bullish momentum.
- Massive liquidations totaling $389.5 million have rocked cryptocurrency markets, with BTC shorts accounting for $82.7 million in recent price movements.
Bitcoin, the industry’s leading cryptocurrency
BTC
$94154
24-hour volatility:
0.8%
Market capitalization:
$1.87T
Vol. 24 hours:
$57.09B
It printed a series of large 14-hourly candles on Friday, its longest streak since 2017, and suggests that whales appear to be actively buying the current dip and that buying pressure is increasing. As the inauguration of a cryptocurrency-friendly administration approaches, digital asset market participants are paying close attention to what BTC will do next.
As you can see in the chart below provided by TradingView, the 14-hour period was printed between 9 PM GMT on January 9 and 11 AM GMT on January 10. This price trajectory of Bitcoin has confused traders on social media platform X (formerly Twitter). That’s because the market-leading cryptocurrency has been weak over the past few days, falling to a low of $91,771 before rebounding to a daily high of $95,770.
Vetle Lunde, senior analyst at K33 Research, spoke about this strange price movement of BTC in an candle. The cryptocurrency community has speculated about the possibility of institutional buyers opening new positions in BTC.
In-Depth Analysis of Bitcoin Price Action
According to CoinMarketCap data, Bitcoin is trading at $95,078 at the time of this writing, up 2.52% in the last 24 hours. Last week the cryptocurrency fell 3.28% and over the past 30 days it is down 5.28%. The digital asset fell 11.74% from its all-time high of $108,268 hit 27 days ago.
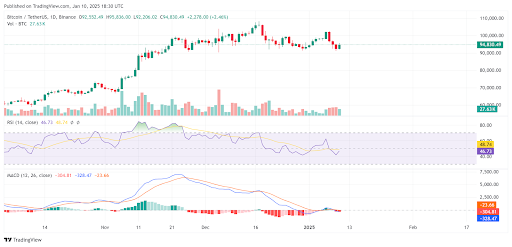
The Relative Strength Index (RSI) for the Bitcoin price trajectory in the chart below shows a value of 46.73, meaning that sellers are in control. However, the slope of the line indicates that buyers are pushing back and seeking control. A $100,000 retest seems likely.

The MACD indicator confirmed a bearish divergence on Bitcoin’s daily time frame, with the signal line (red) rising above the MACD line (blue). The MACD histogram has also turned red, but the lines are very close, so either side could benefit.
Finally, data provided by Coinglass confirms that a massive $389.5 million was liquidated from the cryptocurrency market as Bitcoin unexpectedly surpassed the $95,000 price level, with the broader market also showing strength. Over $128.23 million was liquidated in the last four hours, including $82.7 million in BTC shorts.
next
disclaimer: Coinspeaker is committed to providing unbiased and transparent reporting. This article aims to convey accurate and timely information, but should not be taken as financial or investment advice. Market conditions can change rapidly, so please verify the information yourself and consult with experts before making any decisions based on such information.


