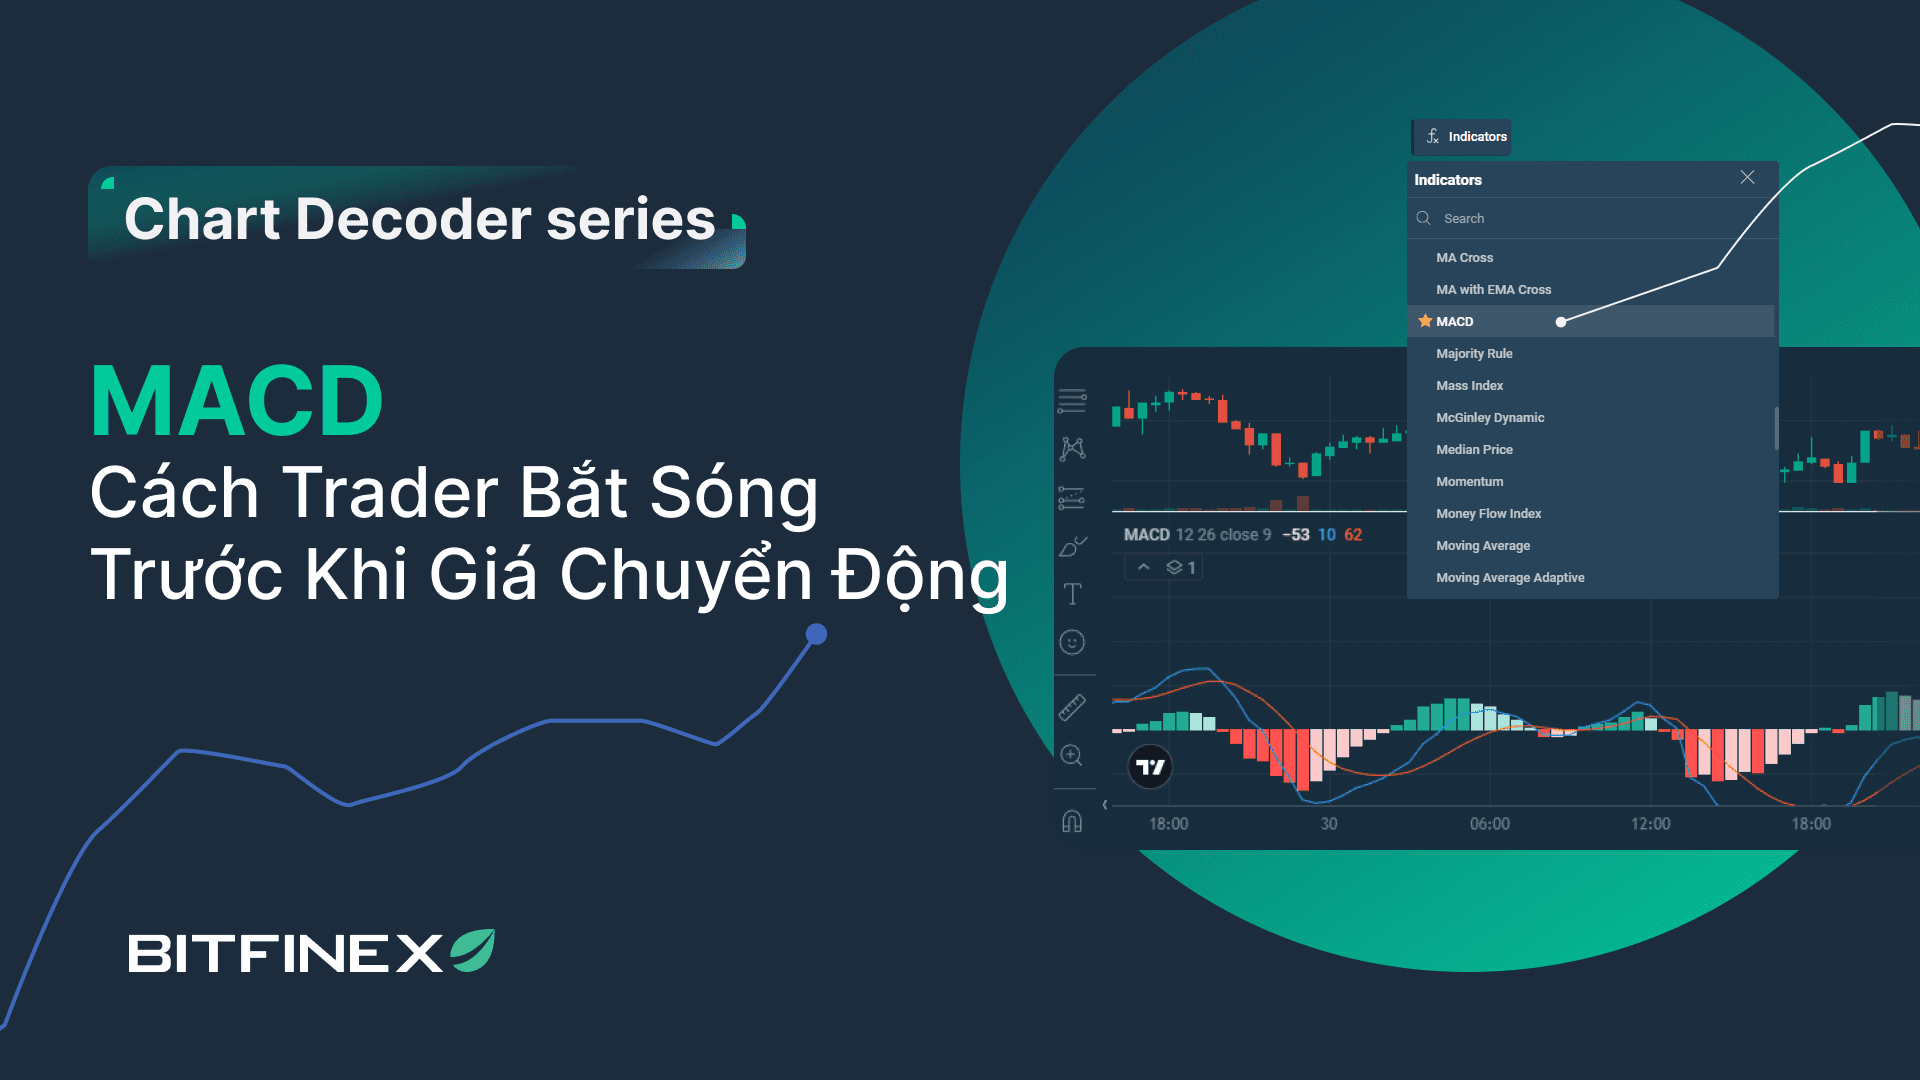
May 5th Chart decoding series: MACD- “Radar” detects the market and captures signals in the initial command.
In education
Welcome to the chart decoding chain -step step by step to master the technical indicators and price models like experts!
In the previous article, we found SMA & EMA, two powerful tools to read trends. This time, let’s decipher the MACD- “Measurement Index” so that the trader can catch the waves early before the price!
Enter: MACD.
So what is MACD?
MACD indicates an average convergence dysfunction -average dynamic dynamic dynamic dynamic. Does it sound complicated? are you okay! Imagine that MACD is a market speed meter.
- Is exercise/decrease rapidly or weak?
- Can you change the price?
While SMA/EMA speaks to you “Where is the price?”MACD has been released again “Strong or weak”. This is a very fast tool to detect new trends before the price response is clear!
The perfect team of MACD includes three parts.
1. MACD (Blue Line)
- “Momentum”: This line is dancing first when the price changes!
- Increase = Purchase side is full of vitality.
- Reduction = The seller is dominated.
2. Signal sugar (orange sugar)
- “Siren”: Follow the MACD line.
- Orange Green Cut = Purchase Signal (Bull Victory).
- Green falls below orange = sales signal (bear side).
3. Chart bar (red/green bar)
This bar shows Street between green and orange roads.
How to read like this:
- Bulge column = da is breaking up!
- The fever is reduced = DA is shaking!
- Green = cow is “fire” 🔥
- Red = bear is “touching the fire” ❄️
Why do traders like MACD?
- Early wave: Detect a new trend before the price comes to mind.
- IN/OUT Decision: When the momentum increases, it will benefit if the purchase momentum is weak.
- Market strength measurement: Is “shark” accumulating or “frying” flowing?
Real example of BTC/USD
MACD indicator (table below):
- MACD line (green): 326
- Signal Line (CAM): –279
- Orange green cutting = signal increase rate
- Blue histogram is open. = DA is breaking up!
- Cut it below the road 0 = signs of initial reversal!
Dynamic Movement (Main Chart):
- EMA 20th (green): ~ 84,067
- MA 50 days (green): ~ 84,170
- Current BTC Price: 87,269 => BTC is “flight” in the two average lines.
Veteran traders’ recipe:
Combine the MACD + EMA/SMA to check the signal.
Increase the accuracy using MACD near the support/resistance area.
Do not use MACD when the market is next to you – “Fake Trap” is easy to occur!
Try directly in Bitfinex.
- Log in to the Bitfinex account.
- Select a pair of transactions (eg BTC/USD).
- Add “MACD” in the indicator tab.
Remember what you need to follow!
Increased signal: Macd Cut Signal road.
Reduction of signals: Macd Cut Signal road.
The histogram fever has been enlarged. The trend is stronger.
The histogram heat is reduced. Trends weaken.
This practice helps to train the trading intuition over time, so you can act confidently instead of confusion.
MACD is loved by traders for simple reasons. It helps readers to read the market before the price is clear! It is like catching “wind change” before the boat is revitalized!
MACD vs SMA/EMA: What is the actual difference?
Chart Decoding Series Next: How do you know the RSI-overload or too drowning?
Do not forget to follow the Bitfinex Vietnamese community. telegram,,, twitter It was. Facebook To update articles, information and events as soon as possible!

