

Bitcoin’s ‘4-year rule’ may be broken for the first time. Despite record inflows into cash ETFs and growth in corporate Treasuries, markets no longer move in step with the halving cycle.
Instead, liquidity shocks, sovereign wealth allocations, and derivatives growth are emerging as new anchors for price discovery. These changes raise important questions for 2026. Can institutions still rely on the cycle playbook, or will they need to completely rewrite the rules?
Is the cycle finally broken?
Now, as these forces set the pace, the question is not whether the old cycle still matters, but whether it has already been replaced. To test this thesis, BeInCrypto spoke with James Check, co-founder and on-chain analyst at Checkonchain Analytics and former chief on-chain analyst at Glassnode.
For years, Bitcoin investors took the four-year halving cycle as gospel. That rhythm now faces its toughest test. In September 2025, CoinShares tracked $1.9 billion in ETF inflows (nearly half of them into Bitcoin), and Glassnode listed $108,000 to $114,000 as a make-or-break zone. At the same time, CryptoQuant recorded exchange inflows collapsing to historic lows even as Bitcoin hit new all-time highs.
boost
boost
ETF Inflows: New Demand or Reorganization?
September’s ETF inflows highlighted solid demand, but investors need to know whether this is truly new capital or simply existing holders being swapped out of vehicles like GBTC. These differences affect how structurally supported the rally is.
“There will definitely be holders moving from on-chain holdings to ETFs. This is definitely happening, but not the majority… The demand has actually been incredibly huge. We’re talking tens of billions of dollars, and there’s some really serious capital coming in. The difference is that we have a lot of a sell side.”
James pointed out that ETFs have already absorbed about $60 billion in total inflows. Market data shows that this figure is overshadowed by profit-taking by long-term holders amounting to $30 billion to $100 billion per month, highlighting why prices have not risen as quickly as ETF demand would suggest.
Exchange Flow: Signal or Noise?
CryptoQuant shows that Bitcoin’s 2025 highs saw exchange inflows hit an all-time low. Taken at face value, this may indicate structural scarcity. But James cautioned against relying too much on these indicators.
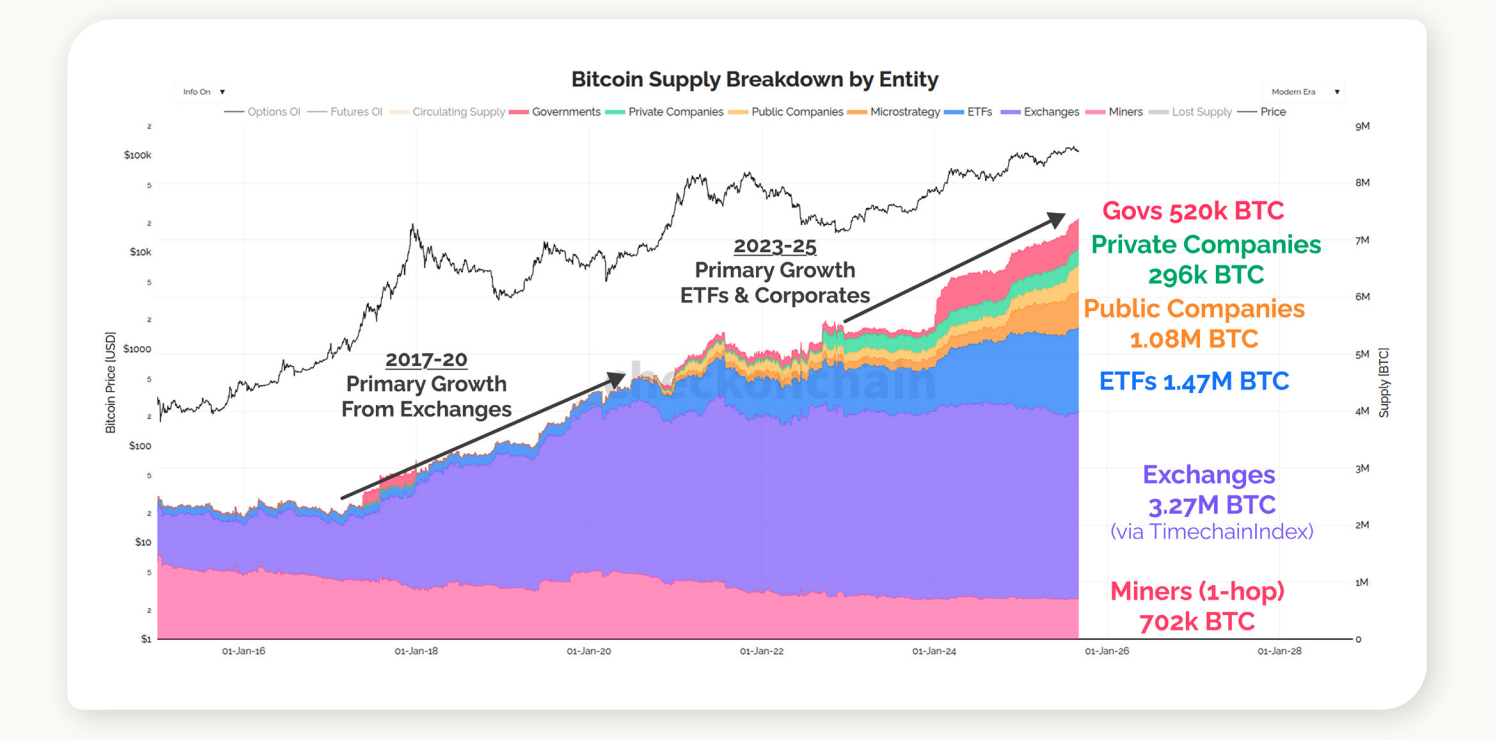
“You won’t see me actually using exchange data very often, because I don’t think it’s a very useful tool. The exchanges think it’s like 3.4 million bitcoins. A lot of these data providers simply don’t have all the wallet addresses because it’s really, really hard to find them all. “I don’t.”
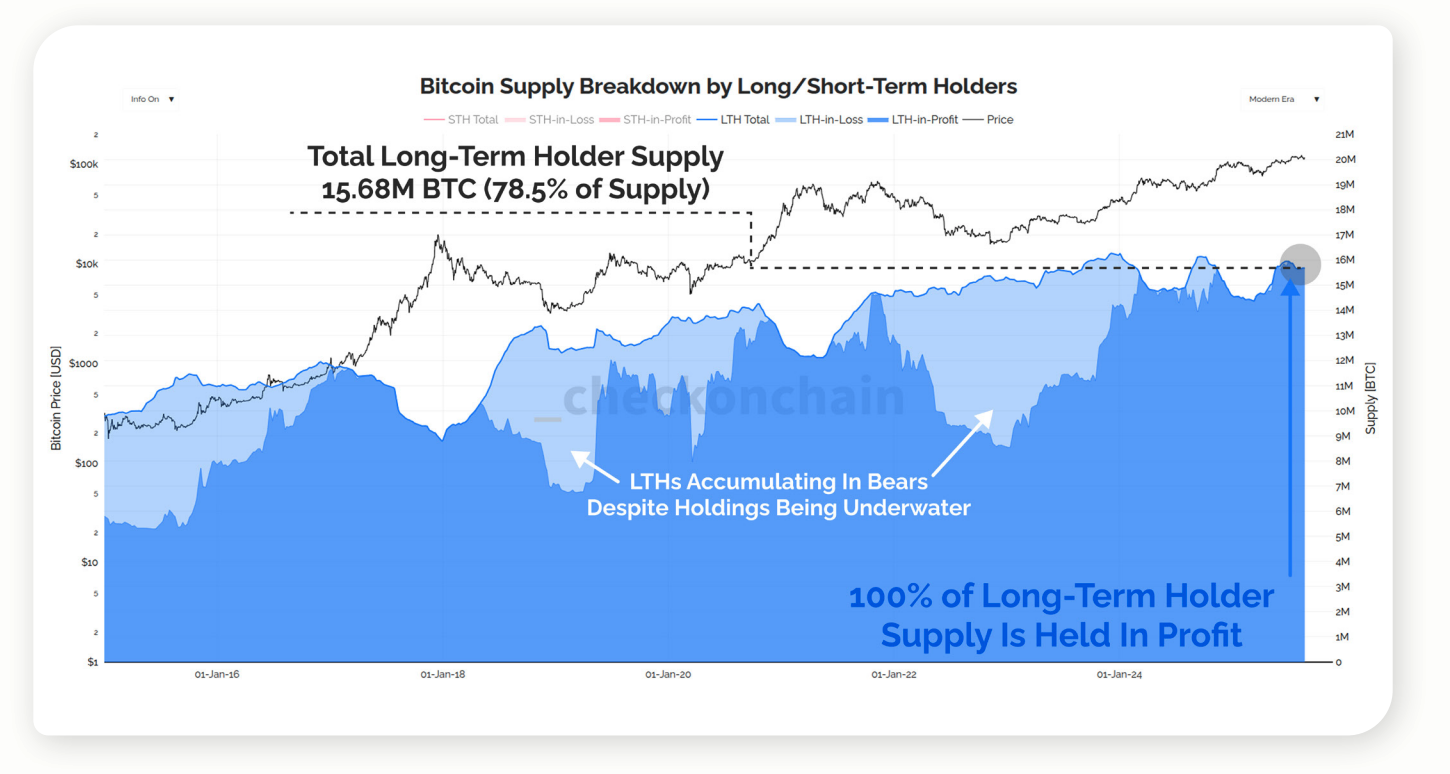
The analysis confirms this limitation, noting that long-term holder supply (currently 15.68 million BTC, or about 78.5% of circulating supply, all revenue) is a more reliable measure of scarcity than exchange balances.
Are miners still moving the market?
For years, mining has been shorthand for downside risk. However, given the current dominance of ETFs and financial flows, their impact may be much smaller than many assume.
boost
boost
“For the Bitcoin network, the selling side that I mentioned before, there are some charts… You can just keep zooming in because it looks like a zero line. It’s too small compared to the existing sales, ETF flows. So I’d say the halving doesn’t matter. And I’d say it doesn’t matter for a couple of cycles. That’s one of the stories I think.”
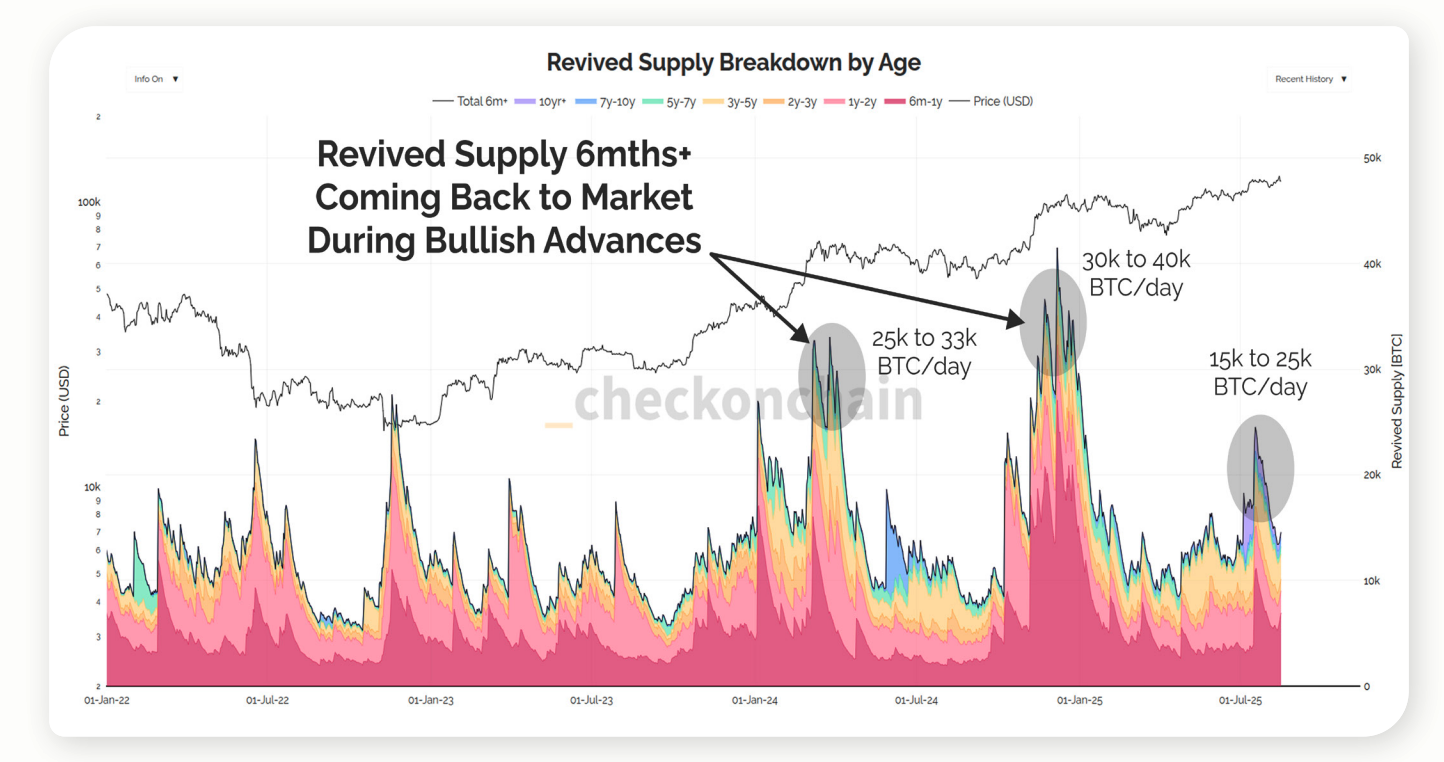
The roughly 450 BTC miners mint each day is a pittance compared to the supply put back in by long-term holders. This can reach 10,000 to 40,000 BTC per day during peak rallies. This imbalance shows why mining flows no longer define the market structure.
From cycle to liquidity regime
When asked whether Bitcoin still respects the four-year cycle or has shifted to a liquidity-driven regime, James pointed to a structural turning point in adoption.
“There are two major turning points in the Bitcoin world. The first was the all-time high in 2017… By late 2022 or early 23, Bitcoin has become a much more mature asset. These days, Bitcoin reacts to the world rather than the world reacts to Bitcoin.”
The analysis supports this view, noting that volatility compression and the rise of ETFs and derivatives have allowed Bitcoin to play an index-like role in global markets. He also emphasized that liquidity conditions, not the halving cycle, now determine the pace.
Realized Prices and a New Bear Market Bottom
Traditionally, realized prices have served as a reliable cycle diagnostic. Fidelity’s model suggests that post-halving corrections occur 12 to 18 months after the event. However, James argued that this metric is now outdated.and Investors should pay attention to where they are. marginal Instead, use cost-based clusters.
boost
boost
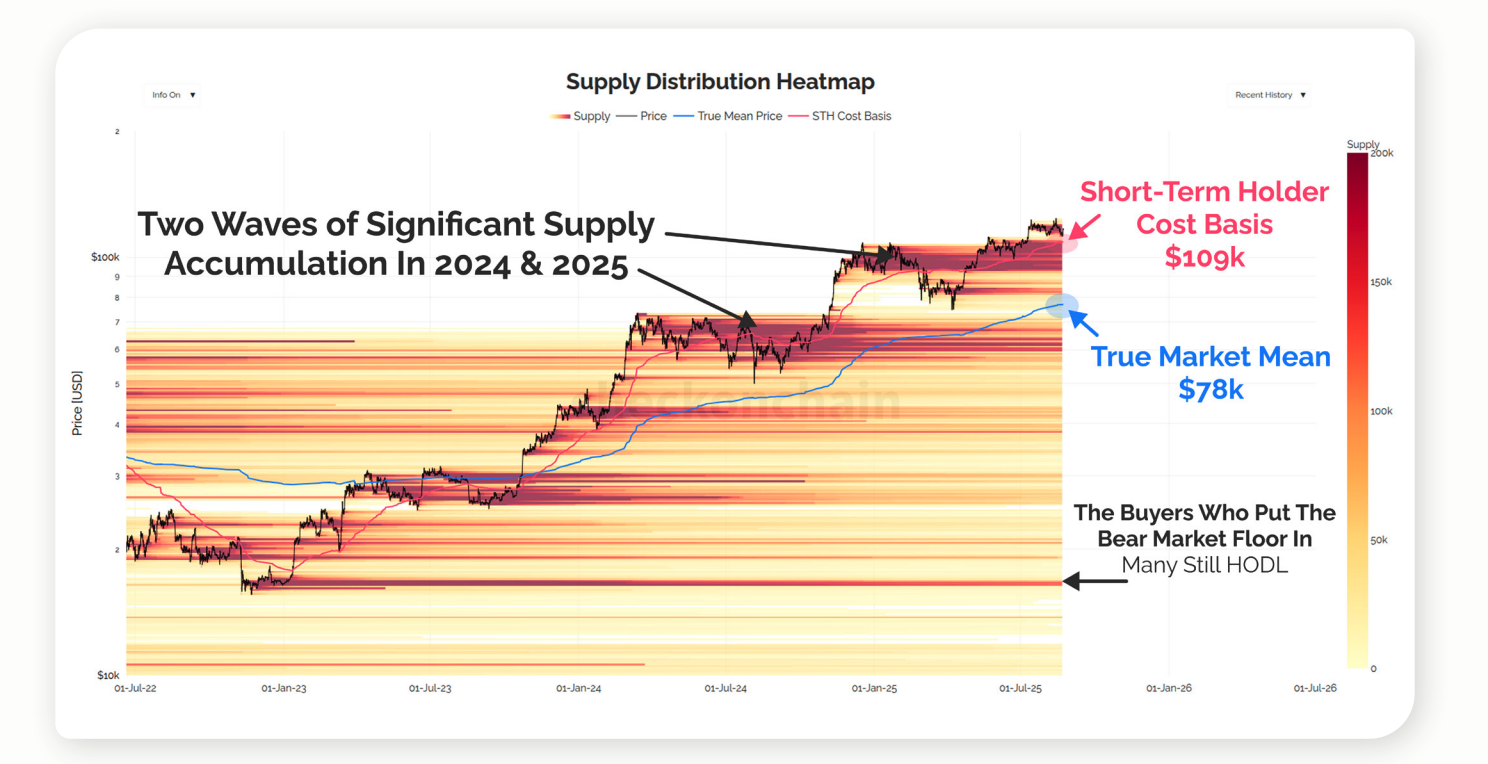
“Usually a bear market ends when the price falls to the realized price. I think the realized price right now is around 52,000, but I actually think that indicator is outdated because it includes satoshis and lost coins… I don’t think Bitcoin will go down to 30,000 again. If there’s a bear market right now, I think it’s going to go down to around 80,000. That seems to me. That’s where a bear market bottom begins to form. “About 75-80K.”
Their data shows an expense base clustered around $74,000 to $80,000, including ETFs, corporate Treasuries, and actual market averages, indicating that this range is now locking in a potential bear market bottom.
Limitations of MVRV and metrics
In contrast, the MVRV Z-Score was not broken, but its thresholds drifted depending on market depth and product mix. James advised flexibility.
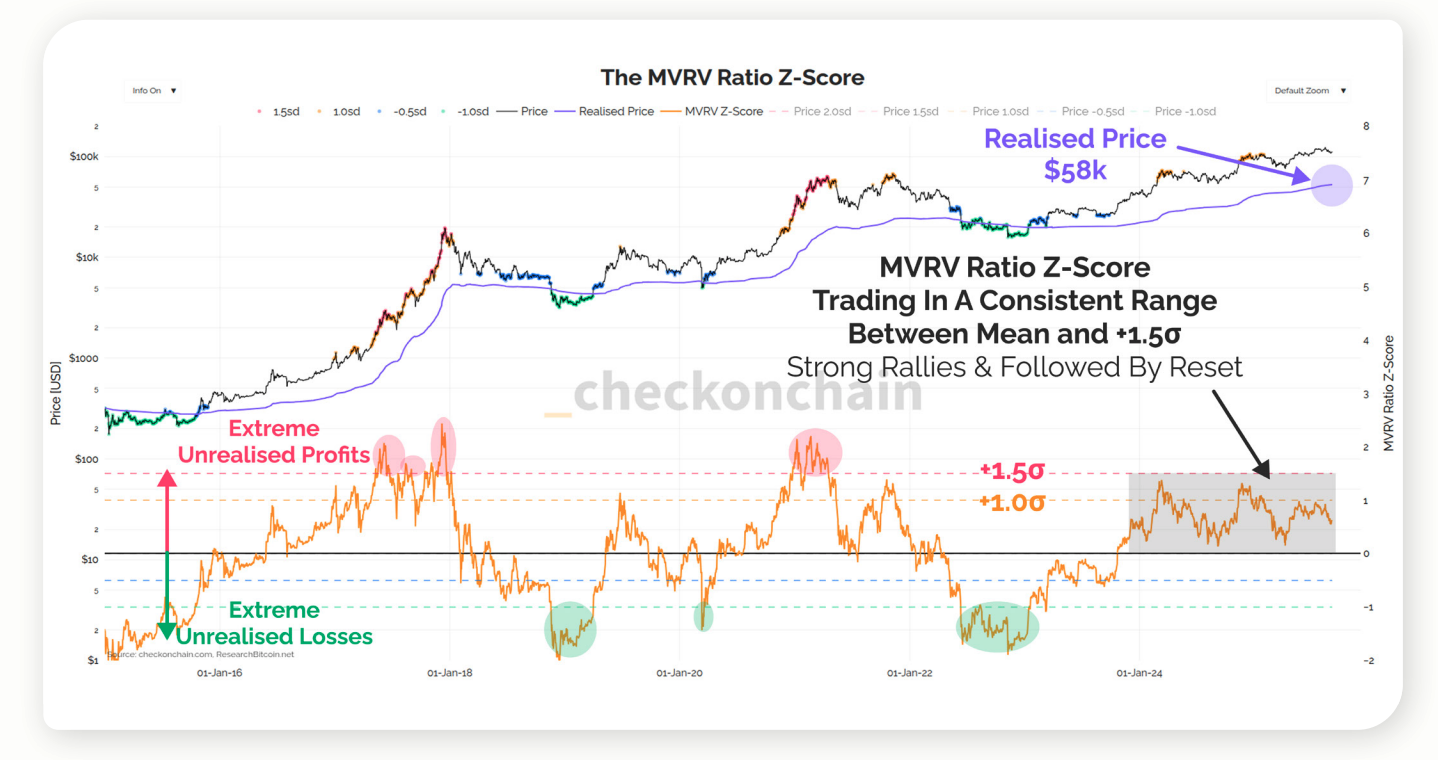
“I think all indicators are still reliable, but historical benchmarks are unreliable. People need to think of indicators as a source of information, not as an indicator of answers. It’s easy to spot explosive highs when all indicators are at their highest levels. What’s really hard to spot is when a bull market is just about to run out of steam.”
Their data show that the MVRV cools near +1σ and then plateaus, rather than reaching its historical extreme. This reinforces James’s view that context trumps fixed cutoffs.
Sovereignty flow and storage risks
Concentration risk has become a key concern as sovereign wealth funds and pensions consider their exposure. James acknowledged that Coinbase holds the majority of Bitcoin, but argued that proof-of-work offsets systemic risk.
boost
boost
“If there’s an area that probably has the greatest concentration risk, it’s Coinbase, simply because they hold almost all of their Bitcoin in ETFs. But since Bitcoin uses proof-of-work, it doesn’t really matter where the coins are. There’s no threshold of risk that would break the system. The market just sorts itself out.”
The data confirms that Coinbase acts as custodian for the majority of U.S. cash ETFs, demonstrating concentration and why James frames Coinbase as a market rather than security risk.
Options, ETFs and American Dominance
James pointed out that derivatives are de.It’s an important factor in Vanguard’s potential entry into the ETF and tokenized markets.
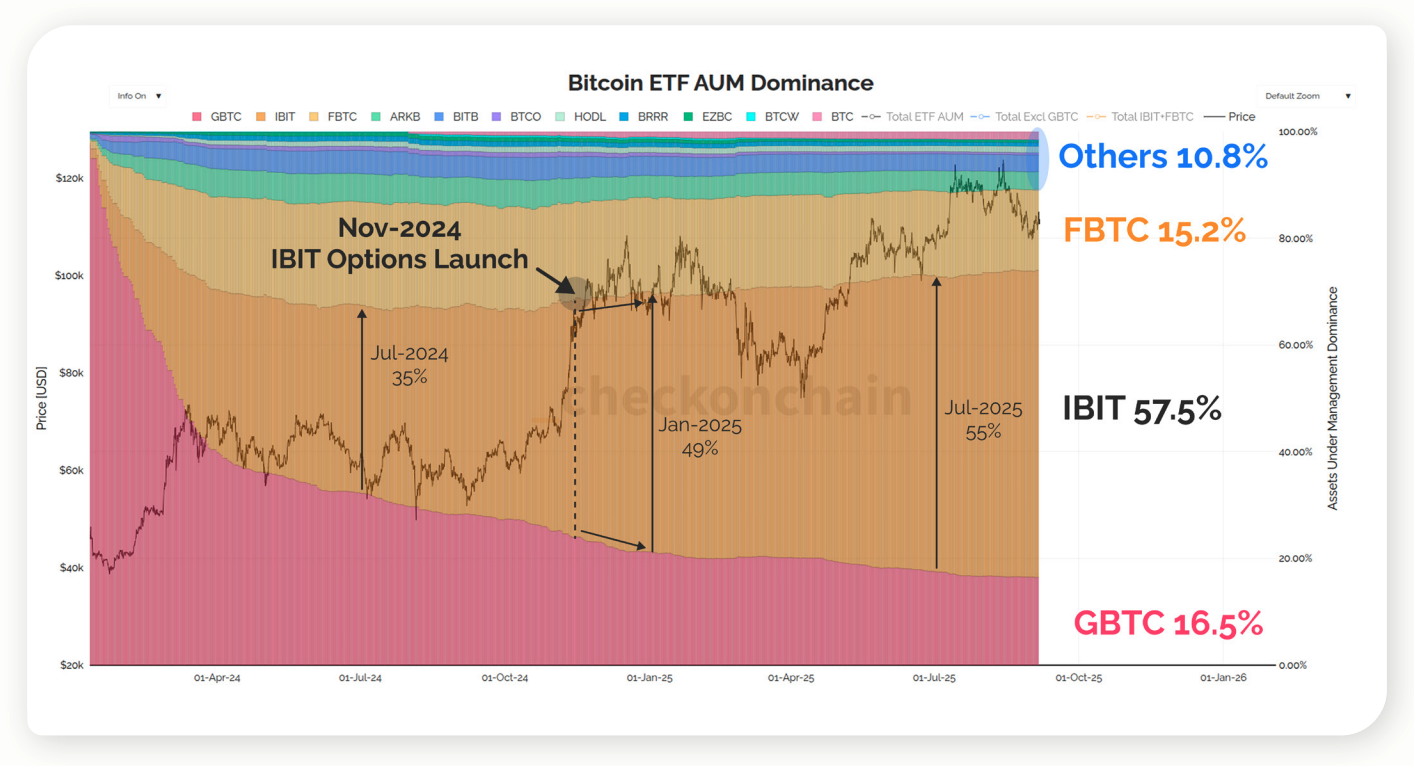
“The most important thing is that it actually has nothing to do with the ETF itself. In fact, the options market is being built on top of it… As of October 2024, IBIT is starting to outpace all other markets. It is now the only one that is seeing significant inflows. The US has about a 90% dominance in terms of ETF holdings.”
Market analysis shows that BlackRock’s IBIT has captured the majority of AUM share since launching options in late 2024, with US ETFs accounting for nearly 90% of global flows, highlighting that derivatives are the real driver of market dynamics. IBIT’s dominance is consistent with reports that US ETFs form almost all new inflows, reinforcing the outsized role of the US.
Closing Thoughts
“Everyone is always looking for the perfect indicator to predict the future. There is no such thing. The only thing you can control is your decisions. If you get down to 75, you need to plan for that. If you get up to 150, you need to plan for that too.”
James argued that preparing strategies for downside and upside scenarios is the most practical way to navigate volatility through 2026 and beyond.
His analysis suggests that Bitcoin’s four-year halving cycle may no longer define its trajectory. While ETF inflows and country-scale capital have introduced new structural drivers, long-term holder behavior remains a key constraint.
Indicators such as realized price and MVRV require reinterpretation, with $75,000 to $80,000 emerging as a likely bottom in the modern bear market. For institutions, the focus in 2026 should shift to liquidity regimes, custody dynamics, and derivatives markets that are currently forming on top of ETFs.