

The S&P 500 Index (SPX) broke its all-time high last week, and Bitcoin (BTC) also broke its 52-week high, showing that risky assets remain strong until the end of the year.
Some analysts believe that Bitcoin has completed its short-term rally and may roll over. Popular analyst and social media commentator Matthew Hyland warned in a post on .
Typically, the first leg of a new bull market rally is driven by the frontrunners, but after a significant move occurs, profit booking begins and traders start looking for alternative opportunities. Although Bitcoin did not roll over, several altcoins began moving higher, signaling a potential shift in interest.
Can Bitcoin continue its upward trend and reach $48,000 in the next few days? Will interest in selected altcoins increase? Let’s take a look at the chart of the top five cryptocurrencies that could remain strong in the near term.
Bitcoin Price Analysis
Bitcoin is consolidating in a tight range near minor resistance at $44,700, indicating that bulls are not rushing for an exit in anticipation of another leg higher.

Rising moving averages and Relative Strength Index (RSI) in overbought territory indicate that bulls still have the upper hand. If the price rises from current levels and rises above $44,700, it would signal a resumption of the uptrend. The BTC/USDT pair could then go up to $48,000.
Conversely, if the price falls below $42,821, the pair could fall towards the 20-day exponential moving average ($40,608). This is an important level to keep an eye on as a bounce would mean the uptrend remains intact, but a drop below it would signal the start of a deeper correction towards the 50-day simple moving average ($37,152).

Looking at the 4-hour chart, we can see that the bulls are trying to hold the price above the 20-EMA. If successful, the pair could rebound above $44,700. The bulls could surge to $48,000, which would likely act as a huge resistance.
Alternatively, it suggests profit booking for short-term traders if the price falls below the 20-EMA. The pair may fall to the 38.2% Fibonacci retracement level of $41,993 and later to the 50% retracement level of $41,157.
Uniswap price analysis
Uniswap (UNI) broke above the overhead resistance of $6.70 on December 9, completing a double bottom pattern.

The bears are trying to trap the aggressive uptrend by taking the price below the breakout level of $6.70. If that happens, the UNI/USDT pair could fall to the 20-day EMA ($6.10), an important level to watch out for.
If the price bounces off the 20-day EMA, the bulls will attempt to push the price above $6.70. If successful, the pair could jump to $7.70 and eventually reach the pattern target of $9.60.
Conversely, a drop below the 20-day EMA suggests a breakout is a bulltrap. The pair could then plummet to its 50-day SMA ($5.32).

The pullback is trying to find support at the 20-EMA. If the price rises and stays above $6.70, the chances of a rise above $7.13 increase. That could begin the next upward trend towards $7.70.
Instead, if the 20-EMA fails to hold, the next stop will likely be at $5.80. This is an essential support that the bulls need to defend as a breakout could cause the pair to collapse towards $4.80.
Optimistic price analysis
After struggling for several days, bulls pushed Bullish (OP) above solid overhead resistance at $1.87 on December 7, signaling the start of a new upward trend.

Typically, price retests the breakout level before a new trend begins. Bears will try to push the price below $1.87 while bulls will try to turn it into support. If the price rebounds from $1.87, the OP/USDT pair could rise to $2.30. A break above this resistance could push the price up to $2.60.
This optimistic outlook could be invalidated in the near term if the price declines and plummets below $1.87. The bears will likely strengthen further as the price falls below $1.60.

The price has risen from the 20-EMA, which indicates that sentiment is still positive and traders are buying on dips. Bulls will try to push the price above the local high of $2.30. If successful, the pair could begin the next phase of its uptrend.
Conversely, if the price declines from the current level and falls below the 20-EMA, it means profit booking by the bulls. This could push the price to a collapse level of $1.87. At this level, you are likely to witness fierce battles between bulls and bears.
Related: AI deepfake nude service surges in popularity: study
Celestia Price Analysis
Celestia (TIA) is showing a strong upward trend, rising from $1.90 on October 31st to $11.50 on December 6th. This sharp rise may have tempted short-term traders to book profits near $11.50, triggering a pullback.

The bulls will try to defend the 38.2% Fibonacci retracement level of $9.01. To secure a path to a retest of $11.50, buyers would need to push the price above $10.50. A breakout and close above this level could begin the next phase of the uptrend. The TIA/USDT pair may soar to $14 and later to $16.
Conversely, if the $9.01 level is broken, the pair could fall towards the 20-day EMA ($7.75). A bounce from this level would indicate that the uptrend is intact, but a break below this level could signal a short-term change in trend.

Bulls are trying to protect the 50-SMA, but failure to sustain the bounce could increase the chances of a breakdown. If the 50-SMA is broken, the pair could fall towards the 50% retracement level of $8.25. A flat 20-EMA and RSI near the midpoint suggest range-limiting action in the near term.
Buyers need to push the price above the downtrend line to maintain positive momentum. The pair could then attempt a rally up to $11.50.
Stack Pricing Analysis
STX (STX) is undergoing a correction in an upward trend. The bulls are trying to stop the decline near the 38.2% Fibonacci retracement level of $0.99, which is a positive sign.
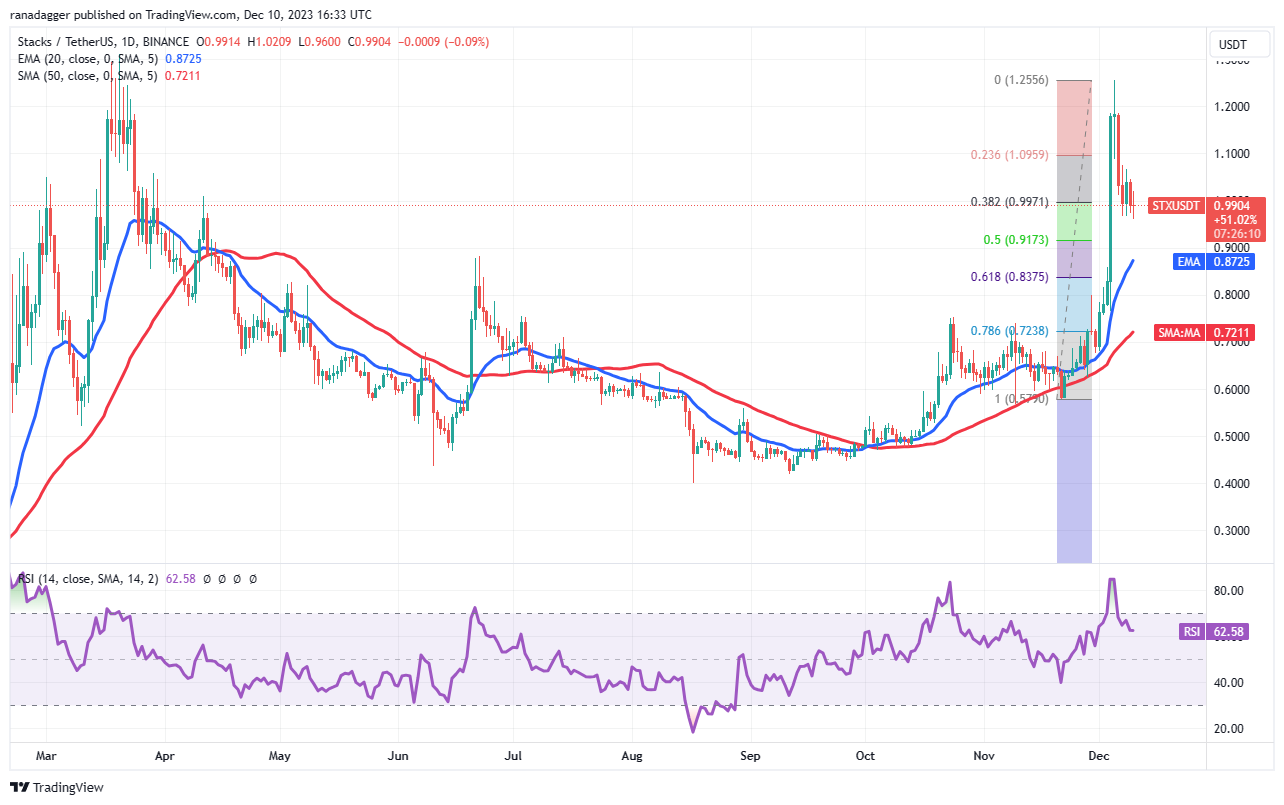
Shallow declines indicate bulls are keen to buy on the dip. This increases the likelihood of a retest of the local high of $1.25. Bears are expected to build a strong defense in the area between $1.25 and $1.31, but if buyers clear it, the STX/USDT pair could extend the upside to $1.60.
Immediate support for the downside is at $0.96. A breakout of this level could see the pair adjust towards the 20-day EMA ($0.87). Such a deep decline could delay the start of the next uptrend.

The pair is finding support near the 50-SMA, which indicates that lower levels continue to attract buyers. On the upside, resistance to watch is $1.08. If the bulls overcome this barrier, the pair could retest the local high of $1.26.
The 20-EMA is gradually moving lower and the RSI is near its midpoint, indicating that the bears have a slight advantage. A close below $0.96 could open the door for a decline down to the 50% retracement level of $0.92.
This article does not contain investment advice or recommendations. All investment and trading activities involve risk and readers should conduct their own research when making any decisions.