- Over the last 24 hours, AAVE has gained 4.25%, indicating potential market momentum.
- However, analysis suggests that the recent uptrend is temporary and a downtrend is expected in the future.
Aave (AAVE) has been performing well in the market recently. It has surged by 32.08% in the past month, outpacing many other tokens. This positive trend has continued on the weekly timeframe, with a gain of 16.42%.
Despite this huge gain, new data suggests that AAVE’s rally may be slowing down, which could lead to a significant decline in its trading value.
AAVE’s recent market momentum appears to be temporary
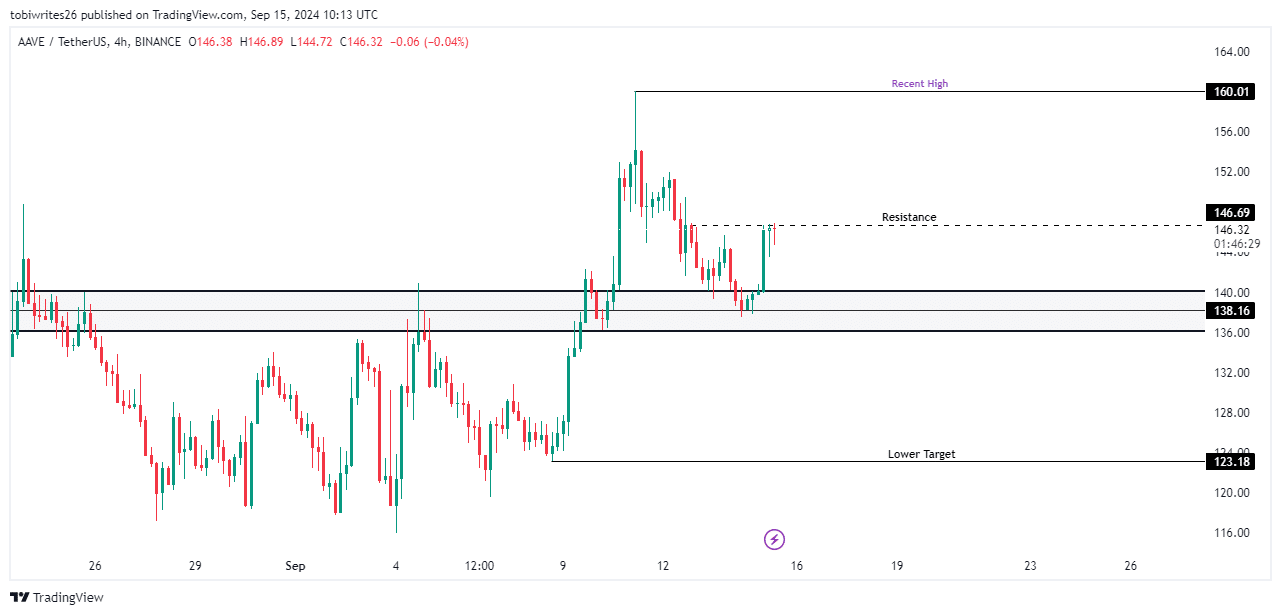
At the time of writing, AAVE was trading at $145.80, $14.21 below its previous high of $160.01. According to AMBCrypto’s analysis, AAVE’s recent rally was triggered by a bounce off the mid-line at a key support level of $138.16.
However, AAVE has hit a 4-hours resistance level at $146.69, which is consistent with strong selling pressure that could potentially push the price lower, possibly retracing to or below the support range between $140.06 and $136.12.
If the support level breaks, the price of AAVE is likely to fall further, especially as selling pressure builds, possibly reaching $123.18.

Source: Trading View
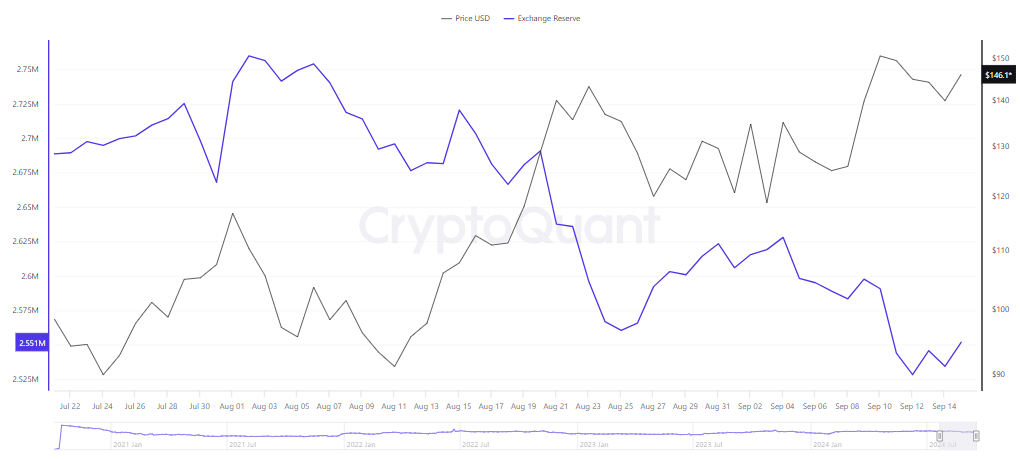
Increased supply may have a negative impact on AAVE.
According to CryptoQuant data, exchange supply has increased over the last 24 hours, with 2.5 million AAVE currently in supply across multiple cryptocurrency exchanges.
The increase in exchange supply suggests that market participants are selling AAVE assets, which creates a potential surplus.


Source: CryptoQuant
The surge in supply coincided with a positive change in exchange flow, meaning investors are more likely to move AAVE to exchanges to sell or exchange for other tokens, which dampens demand.
As Coinglass reported, this increase in supply and transaction flow has contributed to significant long liquidations. Over the past 24 hours, $260.55k worth of AAVE long positions have been forcibly liquidated as market conditions have turned unfavorable.
Market conditions pose challenges for bulls
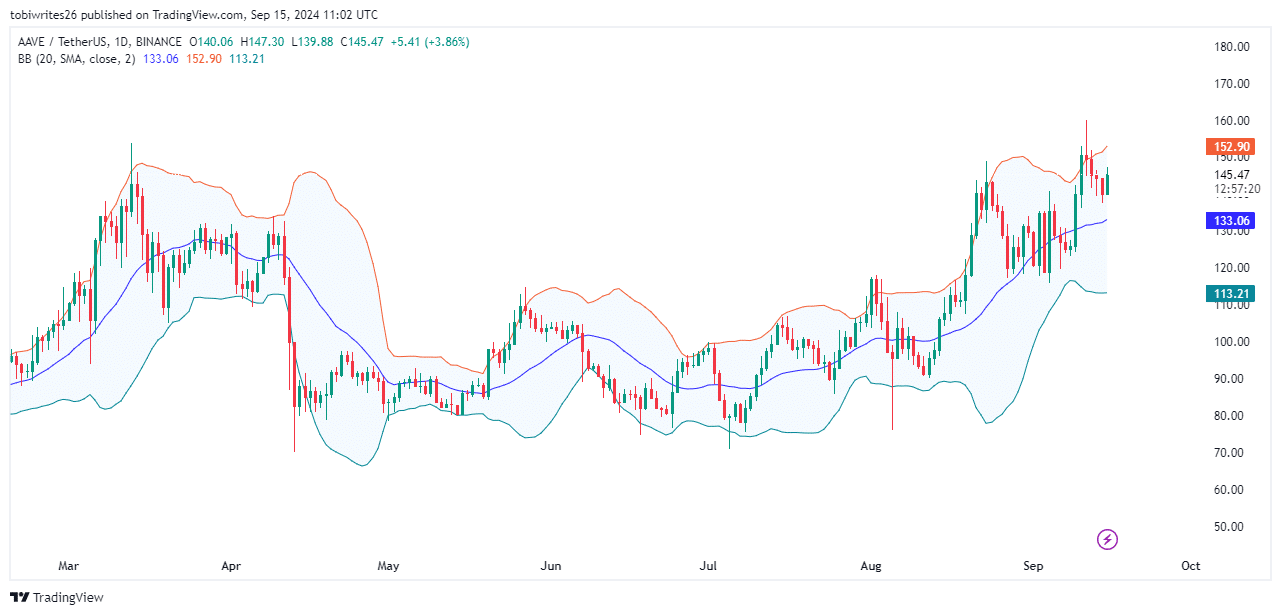
Bollinger Bands, which measure market volatility and identify overbought or oversold conditions, indicate that AAVE has entered overbought territory and is expected to trend down as it looks to recover.
The bands are generally interpreted as follows: a cross over the upper band (red line) indicates an overbought situation, a cross over the lower band (green line) indicates an oversold situation, and a cross over the middle band (blue line) is considered neutral.

Source: TradingView
Moreover, the downtrend is also reflected in a decrease in open interest, which represents the volume of unsettled derivatives transactions.
AAVE’s outstanding balance has decreased from $214.71 million to $164.56 million as of September 11. This indicates that liquidity inflows into the market are decreasing and the asset price is likely to fall further to $140.6 million or lower.

