

join us telegram A channel to stay up to date on breaking news coverage
The price of Bitcoin has risen 1.5% over the past 24 hours, trading at $91,231 as of 11:36 a.m. ET, while trading volume has fallen 45% to $26.7 billion.
This comes as Bitcoiners celebrate “Genesis Day.” This is the day that the anonymous BTC creator Satoshi Nakamoto mined the first block on the Bitcoin network.
Nakamoto mined the Bitcoin Genesis block on January 3, 2009.
“Happy Bitcoin Genesis Block Day,” said Paolo Ardoino, CEO of stablecoin issuer Tether. At the same time, Sam Callahan, Director of Strategy and Research at BTC treasury company OranjeBTC, said: echoed message.
Happy Bitcoin Genesis Block Day
— Paolo Ardoino 🤖 (@paoloardoino) January 3, 2026
The Bitcoin community often points to the message of the Genesis block as a symbol of Bitcoin’s core idea: a decentralized currency that cannot inflate or depreciate due to a fixed supply.
BTC is up 4% in the past week. Can the trend continue? Or will we see a decline following the recent surge?
Bitcoin Price Rebound – Recovery Builds Inside Rising Channel
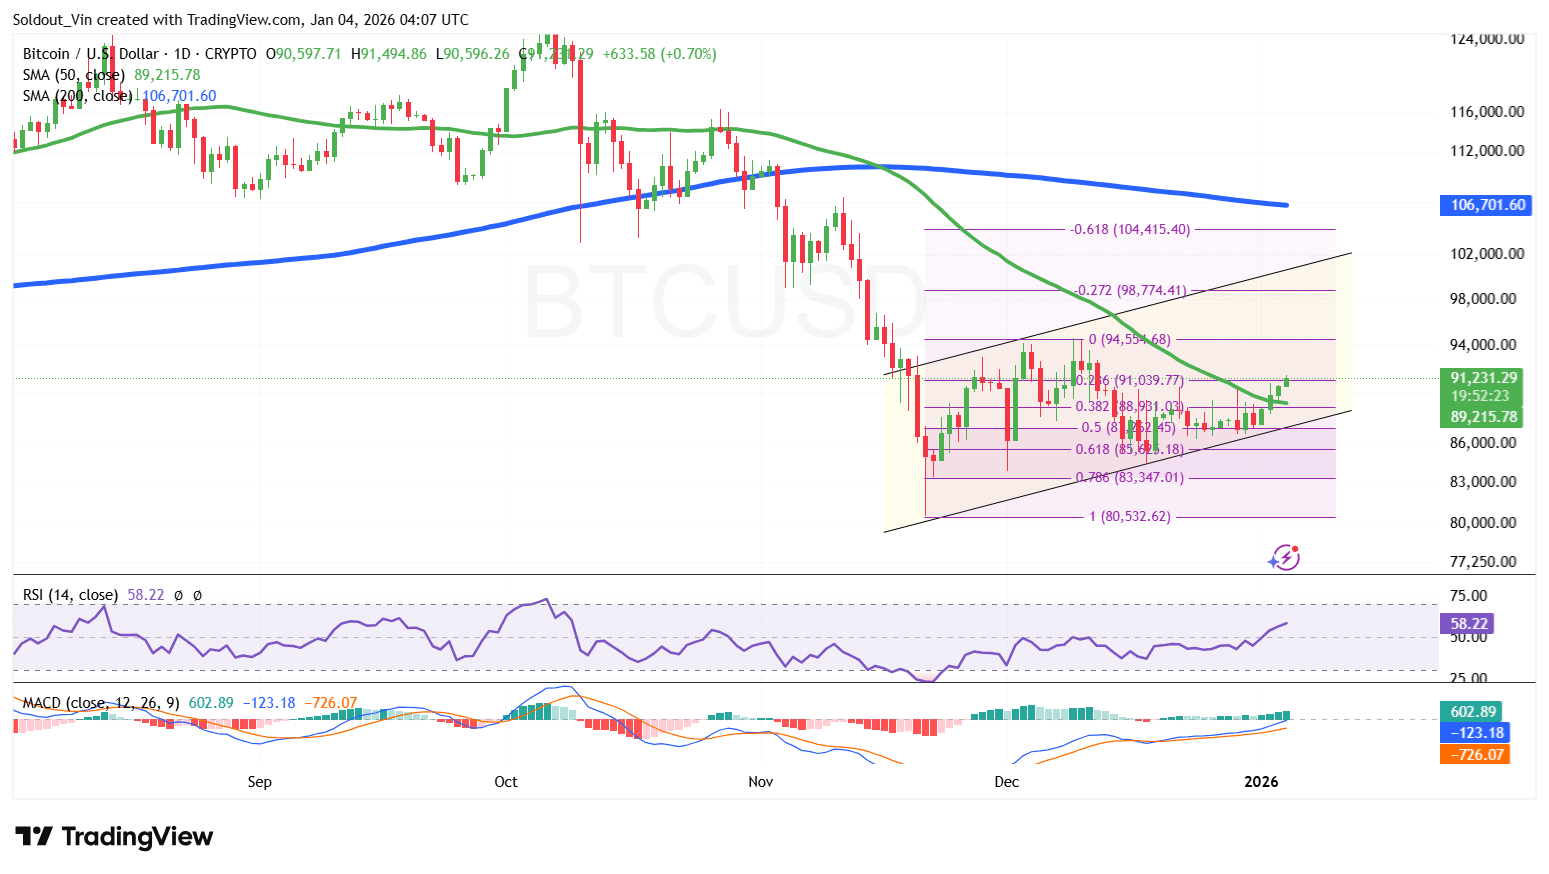
that BTC price It is showing steady signs of recovery after rebounding from recent lows near $80,500 and trading above key Fibonacci support levels in the $85,500-$88,000 region.
This recovery came as Bitcoin attempted to stabilize after a sharp corrective move in the $110,000-$115,000 region. In this region, the flagship cryptocurrency has faced extreme selling pressure after a prolonged rally.
Bitcoin’s decline accelerated as the price fell below the 50-day and 200-day simple moving averages (SMAs), confirming that the structure had turned bearish as the market entered a correction phase. Failure to stay above the 200-day SMA of around $106,700 signaled the start of a deeper downtrend.
The selling drove BTC through several Fibonacci retracement levels, with the 0.618 Fib level near $85,500 serving as an important demand area. This area attracted buyer attention and helped create a higher low, allowing bulls to regain near-term control.
With this support, Bitcoin began to rise within the ascending channel and regained its 50-day SMA of around $89,200, which now acts as support and reinforces the near-term bullish structure.
Moving Average Convergence Divergence (MACD) showed a bullish reversal. The MACD line has crossed above the signal line and the histogram bar has turned positive above the neutral level. This is a sign of improved momentum and increased buyer engagement.
Meanwhile, the relative strength index (RSI) exceeded 50 and rose to around the midline of 58, indicating that the bullish momentum is strengthening without entering an overbought state, supporting the recovery trend.
BTC price outlook
Analysis of the BTC/USD daily chart shows that Bitcoin is positioned for a continued recovery as long as the price remains above the 50-day SMA and within the rising channel.
If the bullish momentum continues, BTC price could target key Fibonacci resistance levels, with the next upside area being around $94,500, followed by $98,700 (-0.272 Fib). A stronger sustainability could lead to BTC testing the $104,000-$106,700 region, in line with the -0.618 Fibonacci level and the 200-day SMA.
The downside is that if momentum weakens and RSI moves closer to overbought territory, short-term profit-taking could push BTC back towards the $88,000-$89,000 support area.
A break below this area could lead to a deeper decline in Bitcoin price towards the $85,500 (0.618 Fib) area, which remains a key buffer against fresh selling pressure.
Related news:
Best Wallet – Diversify your cryptocurrency portfolio

- Easy to use and highly functional cryptocurrency wallet
- Get early access to the upcoming token ICO
- Multi-chain, multi-wallet, non-custodial
- Now available on App Store and Google Play
- Stake to win native token $BEST
- 250,000+ monthly active users
join us telegram A channel to stay up to date on breaking news coverage