Crypto Flexs
  • DIRECTORY
  • CRYPTO
    • ETHEREUM
    • BITCOIN
    • ALTCOIN
  • BLOCKCHAIN
  • EXCHANGE
  • TRADING
  • SUBMIT
Crypto Flexs
  • DIRECTORY
  • CRYPTO
    • ETHEREUM
    • BITCOIN
    • ALTCOIN
  • BLOCKCHAIN
  • EXCHANGE
  • TRADING
  • SUBMIT
Crypto Flexs
Home»EXCHANGE NEWS»BNB Drops Below $500, Is a Long-Term Downtrend Expected?
EXCHANGE NEWS

BNB Drops Below $500, Is a Long-Term Downtrend Expected?

By Crypto FlexsJuly 5, 20243 Mins Read
Facebook Twitter Pinterest LinkedIn Tumblr Email
BNB Drops Below 0, Is a Long-Term Downtrend Expected?
Share
Facebook Twitter LinkedIn Pinterest Email

BNB recently fell below the important $500 support level, signaling a continuation of the downtrend. This decline shows increasing selling pressure and growing bearish sentiment within the cryptocurrency markets.

As BNB falls below this critical threshold, analysts and traders are watching for further downside moves, potentially targeting lower support levels. A break of the $500 mark is a key indicator of continued market weakness, suggesting that BNB could face continued challenges in the short term.

This article explores the bearish sentiment around this area, with technical indicators providing comprehensive insight into potential future trends, key support levels to watch, and strategies for investors and traders to navigate the ongoing downturn. Price of BNB.

At the time of writing, the price of BNB has fallen by more than 10% and is trading at around $471, with a market cap of over $69 billion and a trading volume of over $2 billion. In the last 24 hours, BNB’s market cap has fallen by 10.88% while its trading volume has increased by 37.43%.

Technical indicators highlight the ongoing bearish market conditions.

On the 4-hour chart, the BNB price is actively downtrending below the 100-day simple moving average (SMA). At the time of writing, the price has risen significantly. Drop down The $500 support level triggered a larger downtrend for the cryptocurrency.

Source: BNBUSDT on Tradingview.com

As the 4-hour Moving Average Convergence Divergence (MACD) is forming, the BNB price is expected to decline further as the MACD histogram is trending below the 0 line with strong momentum. Also, the MACD line and signal line are trending below the 0 line with a good spread due to a sharp decline.

On the 1-day chart, BNB is trading below the 100-day SMA and is attempting to break the 3rd consecutive bearish candlestick with strong momentum. This development suggests that the price is still actively declining and could continue to decline.

B&B
Source: BNBUSDT on Tradingview.com

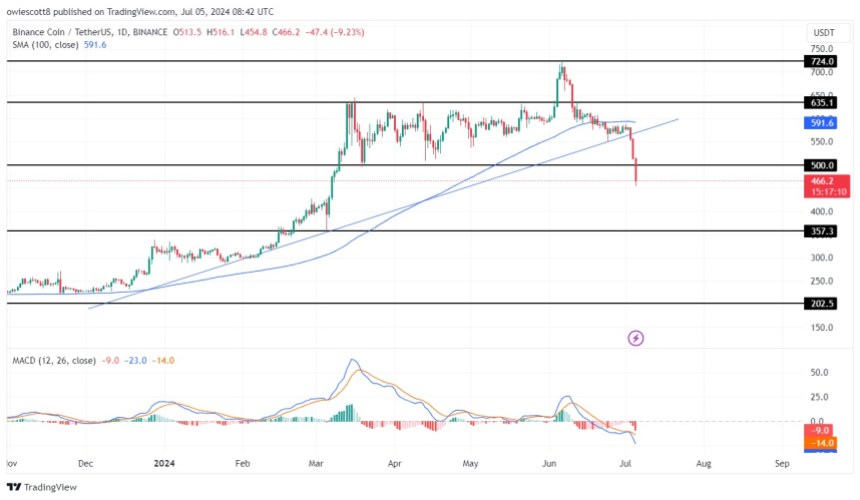
Lastly, the 1-day MACD indicates that the BNB price is likely to decline further as the MACD histogram is trending below the 0 line with strong momentum. It was observed that both the MACD line and the MACD signal line crossed downwards and then trended below the 0 line.

What’s Next for BNB

According to the current analysis, BNB price is heading towards the $357 support level. If BNB price reaches the $357 support level and breaks below it, it may continue to decline to test the $202 support level, and if it breaks the $202 level, it is likely to challenge other lower levels.

However, if the cryptocurrency asset is rejected at the $357 support level, it will start to rise again towards the $500 level. If it breaks above this level, it may continue to rise to test the $635 resistance level, and if it breaks above the $635 resistance level, it may move to test other higher levels.

B&B
BNB trading at $468 on 1D chart | Source: BNBUSDT on Tradingview.com

Featured image from Adobe Stock, charts from Tradingview.com

Share. Facebook Twitter Pinterest LinkedIn Tumblr Email

Related Posts

Ethereum Price at Risk – Bears Lose Momentum Ahead of New Lows

October 9, 2025

Bitcoin Steadies at Rally -Is another powerful brake out just in the future?

October 6, 2025

If this happens, you can see a huge price of $ 1.9.

October 3, 2025
Add A Comment

Comments are closed.

Recent Posts

Pepeto Advances Presale With Staking Rewards And Live Exchange Demo

October 11, 2025

Foundry vs Echidna vs Wake: Fuzz Reduction Comparison

October 11, 2025

Phemex Launches Market Confidence Campaign To Support Traders Through Volatility

October 11, 2025

How SJMine Transforms Daily Crypto News Into Passive Profits

October 11, 2025

Ethereum price plunge creates opportunity for 13% rebound

October 11, 2025

Eightco Holdings Inc. ($ORBS) Expands Its Strategic Vision Into The Enterprise

October 10, 2025

Whale.io Launches Battlepass Season 3, Featuring $77,000 In Crypto Casino Rewards

October 10, 2025

Strengthening the AI ​​Agent Economy

October 10, 2025

‘OG’ Whale Attracts Over $400 Million in Bearish BTC Bet

October 10, 2025

Rhuna Raises $2M Seed Round Led by Aptos Labs to Build Stablecoin Payment Infrastructure for Entertainment

October 10, 2025

Mobile App Change Log 7.17.0

October 9, 2025

Crypto Flexs is a Professional Cryptocurrency News Platform. Here we will provide you only interesting content, which you will like very much. We’re dedicated to providing you the best of Cryptocurrency. We hope you enjoy our Cryptocurrency News as much as we enjoy offering them to you.

Contact Us : Partner(@)Cryptoflexs.com

Top Insights

Pepeto Advances Presale With Staking Rewards And Live Exchange Demo

October 11, 2025

Foundry vs Echidna vs Wake: Fuzz Reduction Comparison

October 11, 2025

Phemex Launches Market Confidence Campaign To Support Traders Through Volatility

October 11, 2025
Most Popular

Ethereum Whale Bulk Purchases of $187 Million ETH in 3 Days, Expecting Further Surge

February 22, 2024

Bitcoin traders are sighing as the BTC price indicator hits new highs.

October 30, 2024

Ethereum is stagnating in price, reflecting the 2016 trend. Is it possible that ETH losses will increase further?

August 22, 2024
  • Home
  • About Us
  • Contact Us
  • Disclaimer
  • Privacy Policy
  • Terms and Conditions
© 2025 Crypto Flexs

Type above and press Enter to search. Press Esc to cancel.