Crypto Flexs
  • DIRECTORY
  • CRYPTO
    • ETHEREUM
    • BITCOIN
    • ALTCOIN
  • BLOCKCHAIN
  • EXCHANGE
  • TRADING
  • SUBMIT
Crypto Flexs
  • DIRECTORY
  • CRYPTO
    • ETHEREUM
    • BITCOIN
    • ALTCOIN
  • BLOCKCHAIN
  • EXCHANGE
  • TRADING
  • SUBMIT
Crypto Flexs
Home»ALTCOIN NEWS»Cardano indicators show a buy signal, but should you take this opportunity?
ALTCOIN NEWS

Cardano indicators show a buy signal, but should you take this opportunity?

By Crypto FlexsSeptember 14, 20243 Mins Read
Facebook Twitter Pinterest LinkedIn Tumblr Email
Cardano indicators show a buy signal, but should you take this opportunity?
Share
Facebook Twitter LinkedIn Pinterest Email
  • At the time of writing, Cardano was range bound but overcame significant resistance in the short term.
  • Despite the downward price trend since April, daily active addresses have remained well maintained.

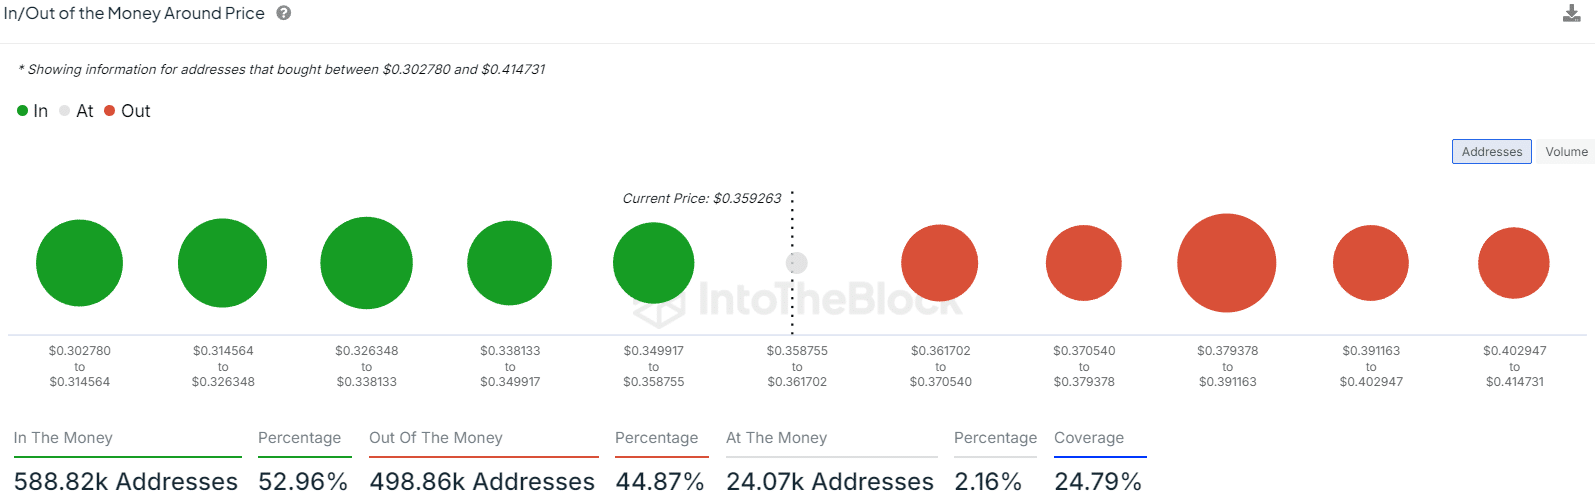
A previous report stated that 76.59% of Cardano (ADA) holders lost money. This statistic looks healthier when looking at holders around the market price at the time of writing.

Source: IntoTheBlock

The +0.86 correlation to Bitcoin (BTC) means that ADA traders should also pay attention to the king coin. The correlation with Ethereum (ETH) is positive but weak, which is slightly good news since ETH has been underperforming recently.

Overview of Cardano’s Key Levels

Cardano 1 day chartCardano 1 day chart

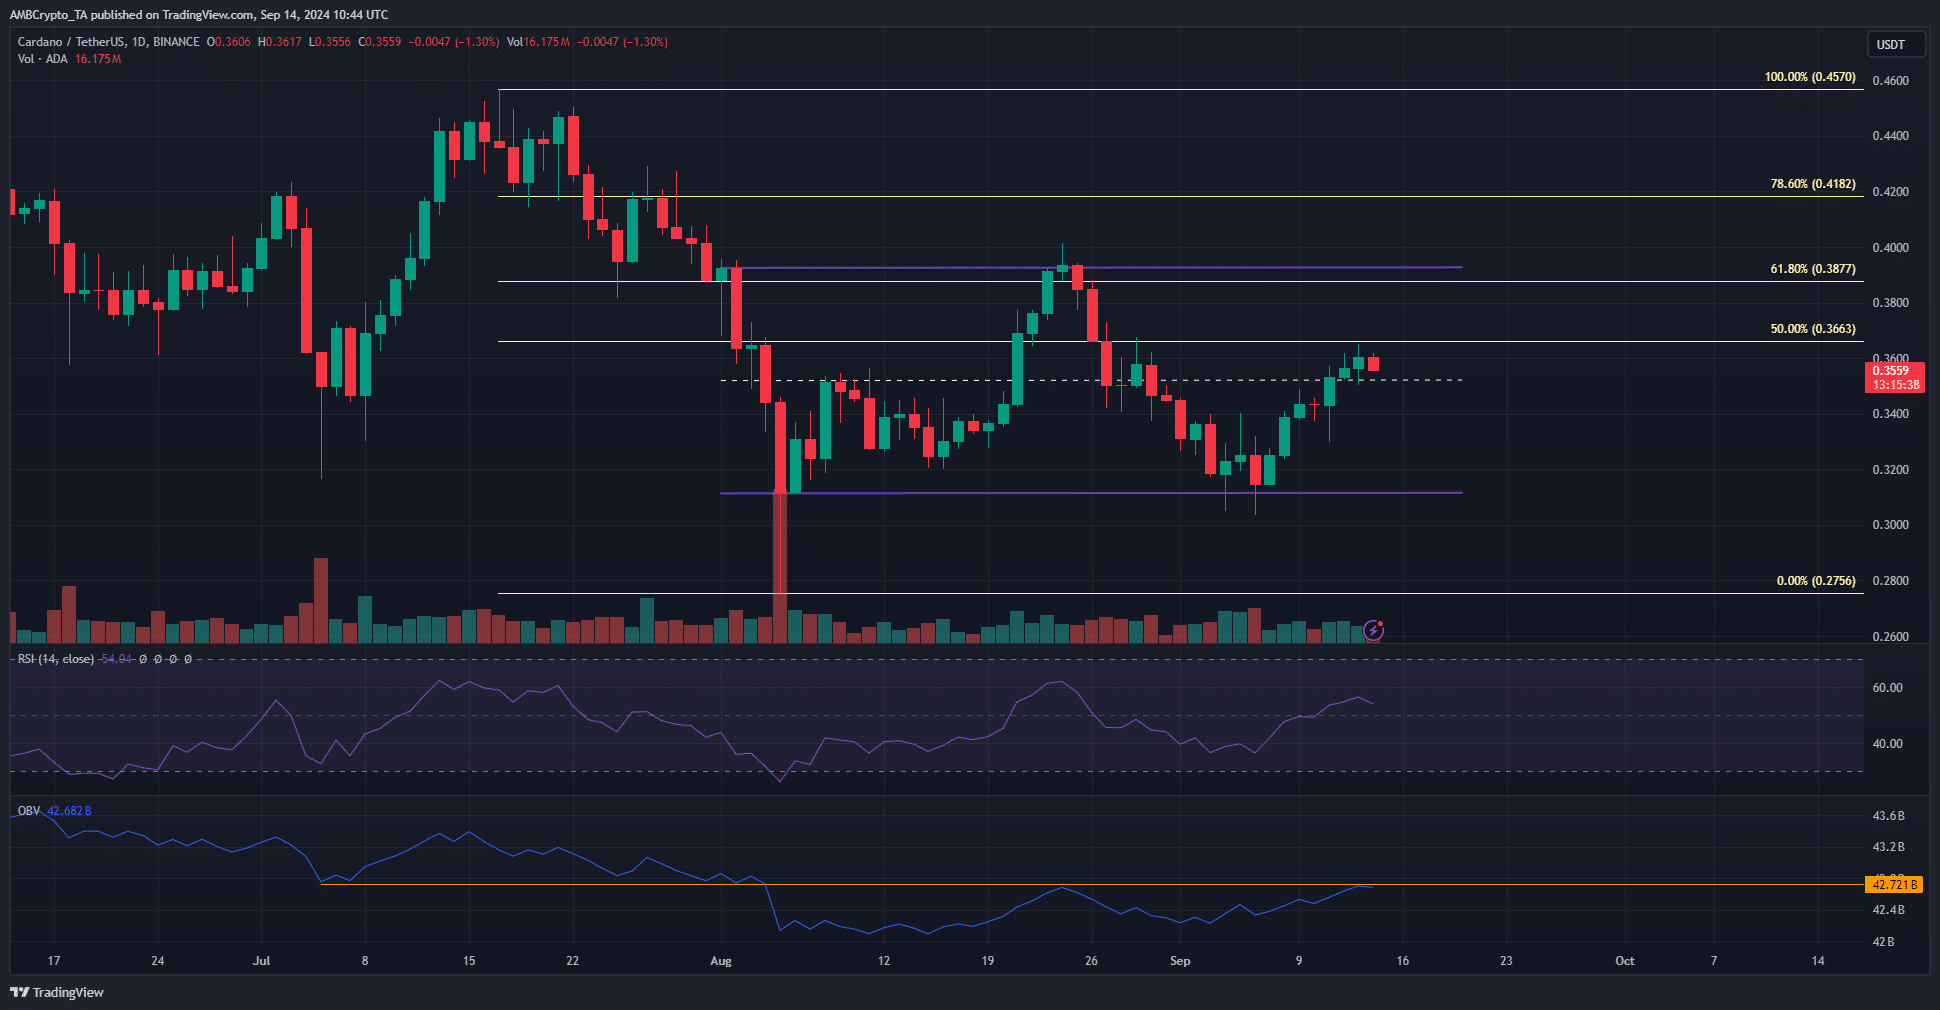
Source: ADA/USDT on TradingView

Cardano’s price action has also been uninspiring lately, with a range formation of $0.311-$0.393 in play since early August. The middle range level of $0.352 was broken a few days ago, and bulls could defend the retest as support.

OBV has been trending up slowly over the past month and seems to be on the verge of making a new high. The daily RSI has also signaled a bullish turn in momentum. Therefore, ADA traders can expect a rally to $0.39-$0.4 on the chart.

ADA In/Out of the MoneyADA In/Out of the Money

Source: IntoTheBlock

Looking at the entry/exit statistics around the price, $0.326-$0.338 and $0.35-$0.358 are the major short-term support zones. Meanwhile, $0.379-$0.391 levels are the tight supply zones. These results are in pretty good agreement with the price action chart.

On-chain indicators show a potential market bottom.
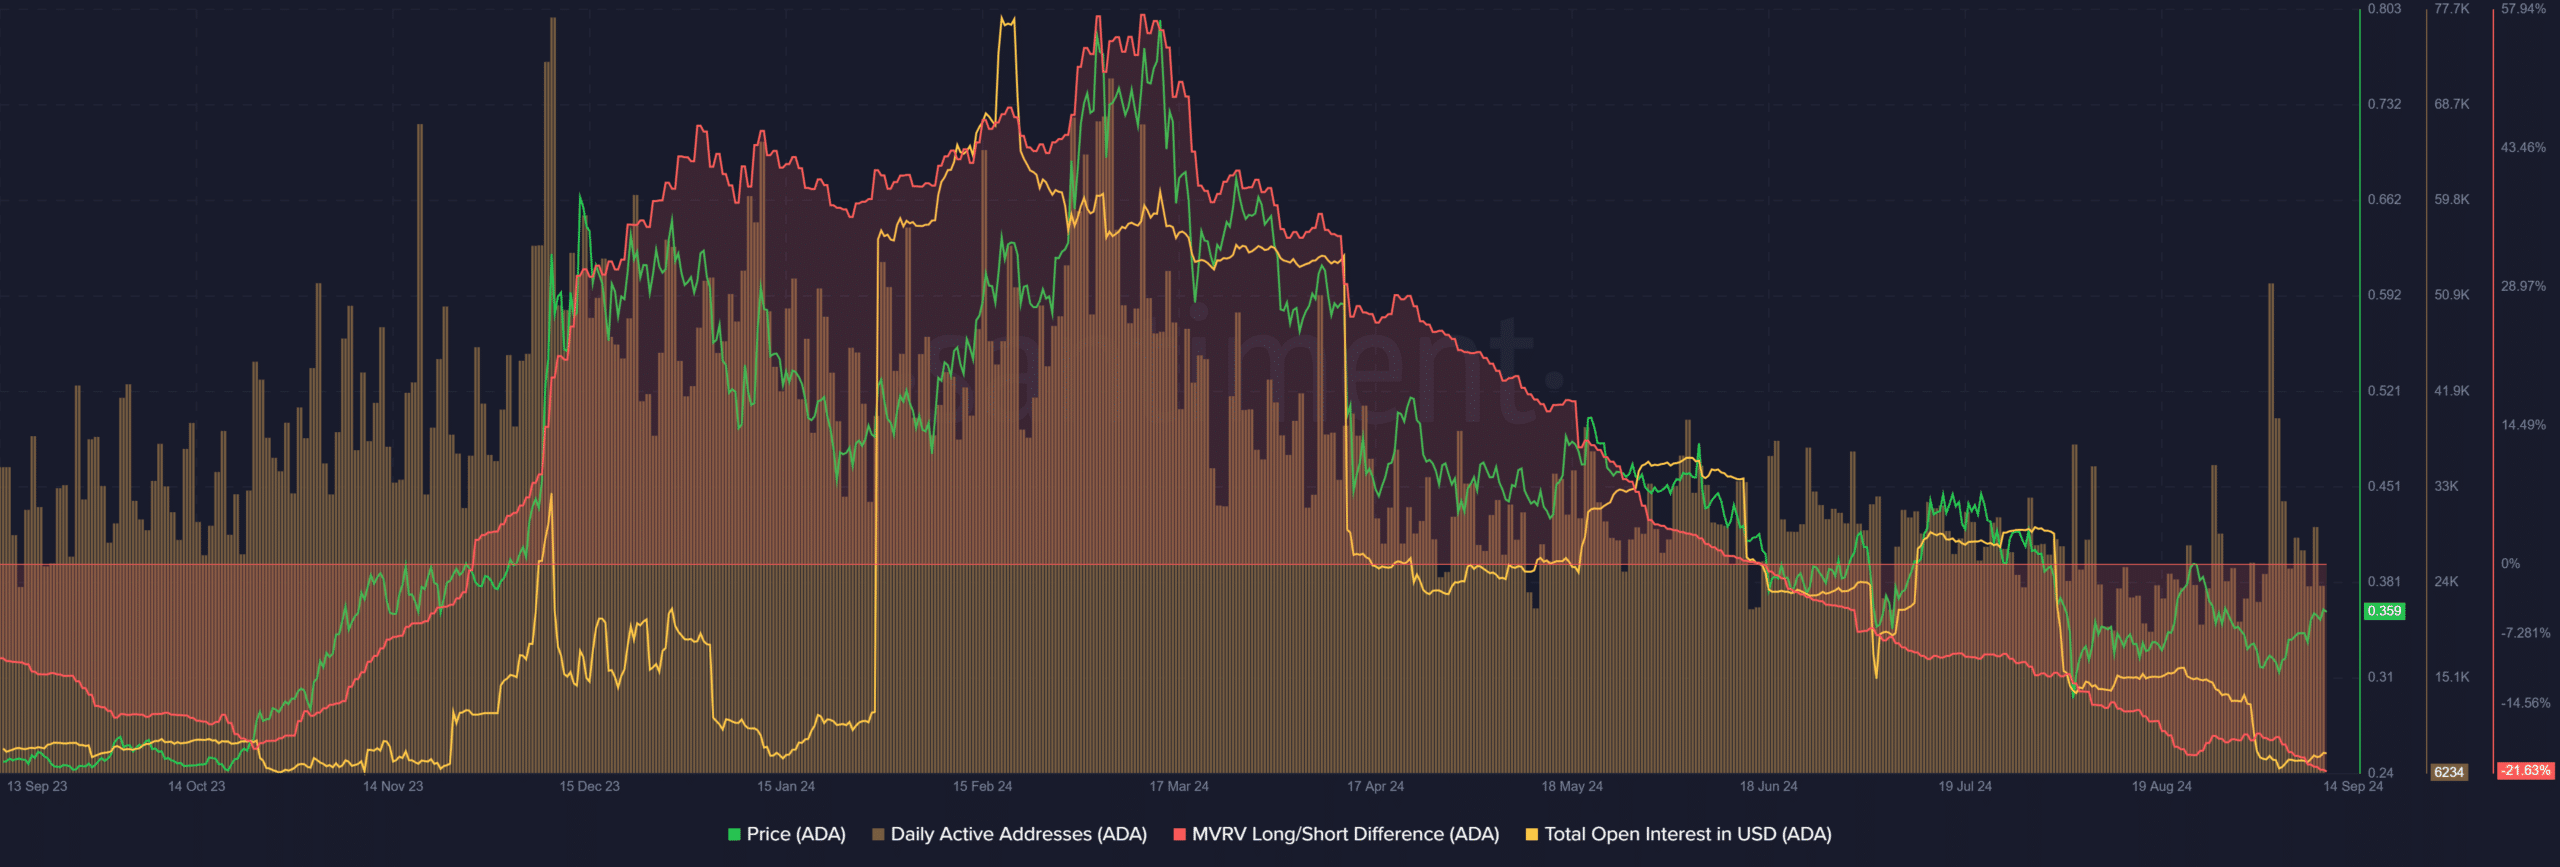
Cardano MVRV Long/ShortCardano MVRV Long/Short

Source: Santiment

The MVRV long/short difference is the difference between the 365-day MVRV and the 60-day MVRV. Therefore, a negative value means that long-term holders have suffered greater losses than short-term holders.

This indicator has fallen below the low set in October 2023, meaning that a potential market bottom for Cardano may now be in progress. At the same time, the daily active addresses indicator has remained relatively stable since April, despite the downward price trend.

In short, if market sentiment and price trends turn bullish, there is a possibility that network participation will increase. Also, the declining open interest shows that speculators are not yet convinced of a strong rally.
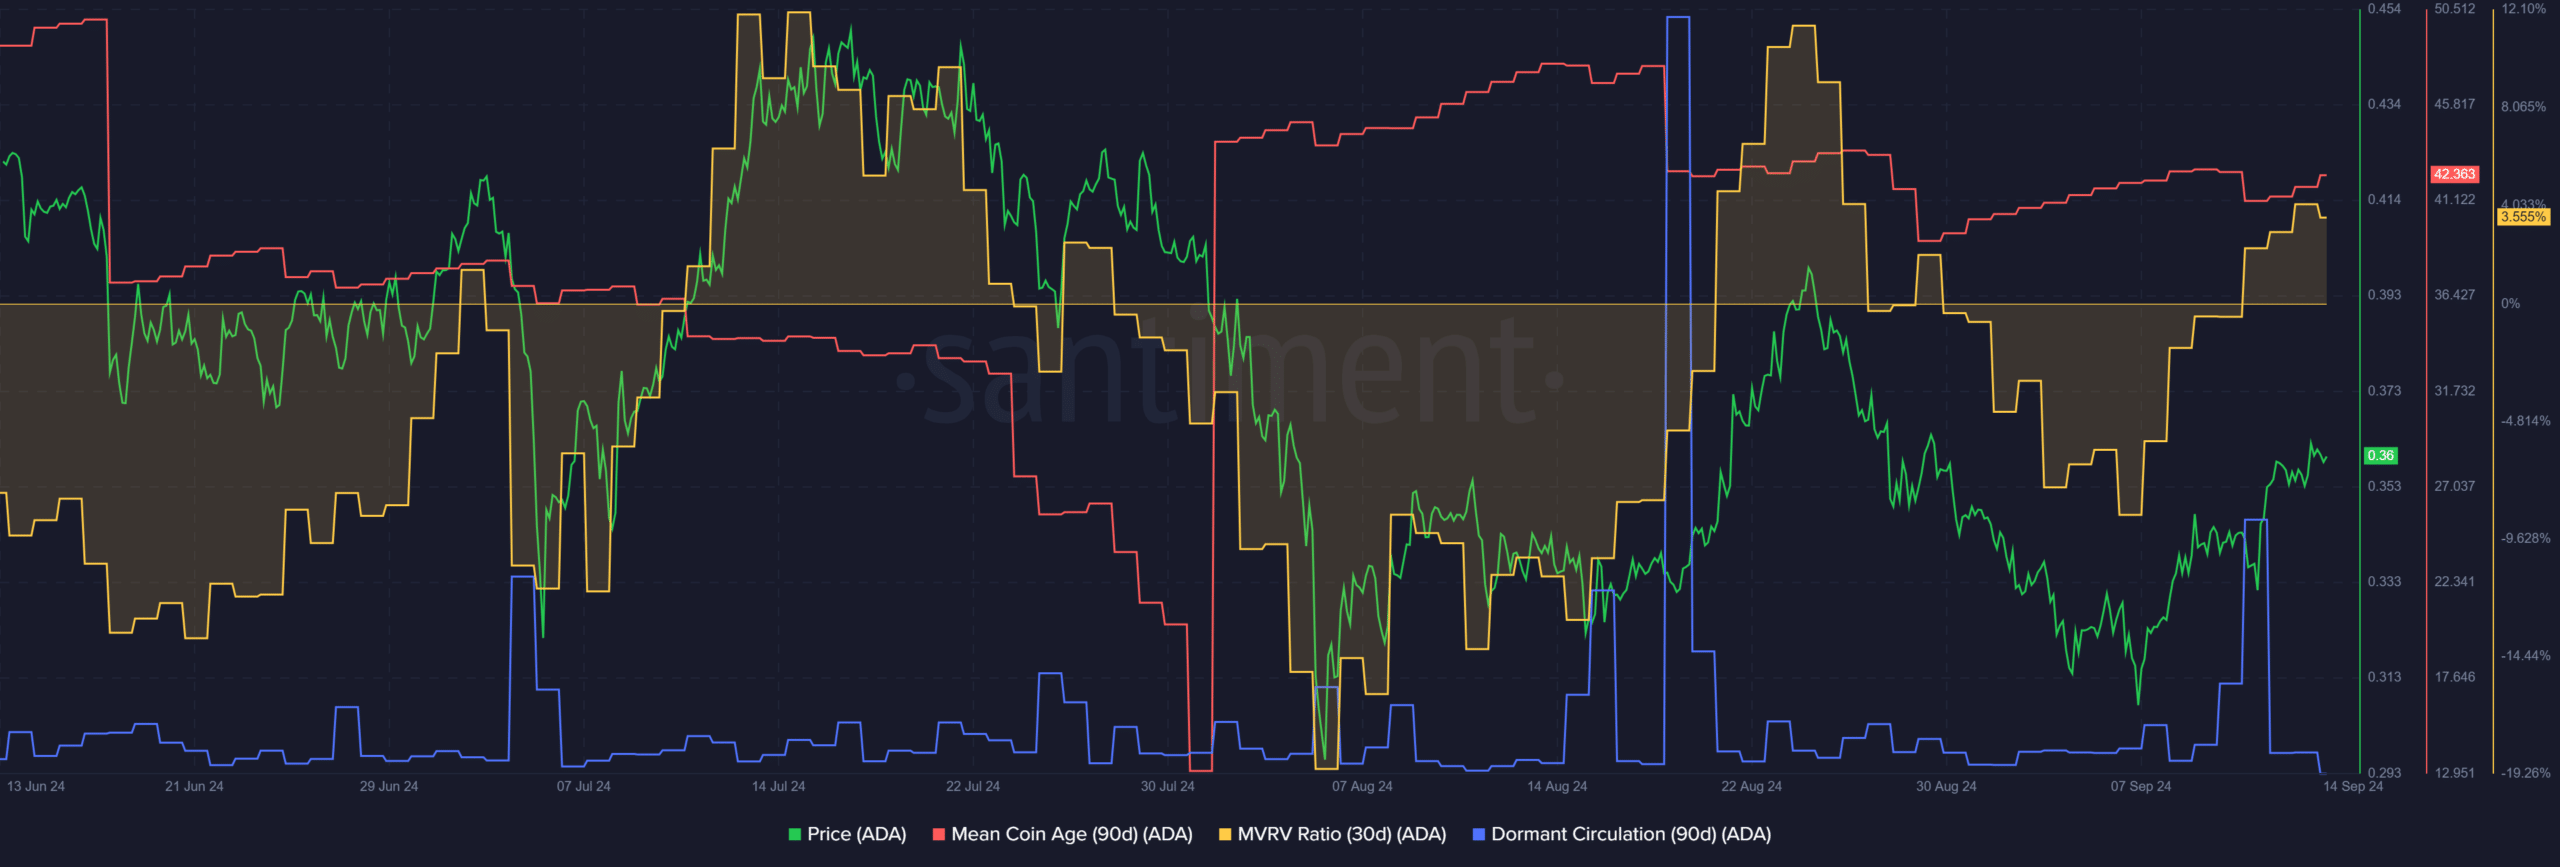
Cardano SantimentCardano Santiment

Source: Santiment

While Cardano may be near the bottom of the market in the long term, the token could be interpreted as slightly overvalued in the short term. At the time of writing, the 30-day MVRV was positive, indicating that there may be selling pressure due to profit-taking.


Is your portfolio green? Check out the Cardano Profit Calculator


Also, the average coin age has not shown any significant trend, but has been increasing over the past three weeks. There was a short-term price drop on September 11 due to a surge in dormant circulation, but ADA recovered quickly thereafter.

Previous: Bitcoin Price Is Facing This Threat. Here’s Everything You Need to Know

Next: Ethereum Exchange Holdings Surge Above 100,000 ETH – Is It Time to Worry?

Share. Facebook Twitter Pinterest LinkedIn Tumblr Email

Related Posts

Binance and Coinbase Suddenly Add Support for New ZK Proof Altcoins

January 8, 2026

Lighter Token (LIT) Overtakes Jupiter — Are Hyperliquids Dangerous?

January 1, 2026

The whale strike trapped Solana in the $122-$145 range. What’s next for SOL?

December 25, 2025
Add A Comment

Comments are closed.

Recent Posts

Impact of ECC team withdrawal on Zcash (ZEC)

January 8, 2026

Binance and Coinbase Suddenly Add Support for New ZK Proof Altcoins

January 8, 2026

BitMEX Launches Equity Perps for 24/7 Stock Trading

January 8, 2026

Bitcoin price plummets to $90,000 as New Year bounce falters

January 7, 2026

Wake Arena: The AI-Driven Audit Service

January 7, 2026

7 Best DeFi Dashboards for 2026 (DeFi Portfolio Tracking)

January 7, 2026

When You Look Into The Transition To New Crypto-based Projects

January 7, 2026

How To Choose The App For Crypto Trading In Bitcoin And Trade Safely

January 7, 2026

How UK Financial Ltd’s ERC-3643 token is shaping the future of regulated cryptocurrency trading.

January 7, 2026

Barclays Invests In Ubyx To Advance Digital Money Connectivity

January 7, 2026

Cango Inc. Announces December 2025 Bitcoin Production And Mining Operations Update

January 7, 2026

Crypto Flexs is a Professional Cryptocurrency News Platform. Here we will provide you only interesting content, which you will like very much. We’re dedicated to providing you the best of Cryptocurrency. We hope you enjoy our Cryptocurrency News as much as we enjoy offering them to you.

Contact Us : Partner(@)Cryptoflexs.com

Top Insights

Impact of ECC team withdrawal on Zcash (ZEC)

January 8, 2026

Binance and Coinbase Suddenly Add Support for New ZK Proof Altcoins

January 8, 2026

BitMEX Launches Equity Perps for 24/7 Stock Trading

January 8, 2026
Most Popular

Ethereum succumbs to selling pressure – 2 factors helping the downtrend

January 8, 2025

Amid the TRUMP meme craze, searches for ‘buy cryptocurrency’ and ‘Solana’ surge.

January 19, 2025

Hong Kong SFC warns cryptocurrency exchanges

February 6, 2024
  • Home
  • About Us
  • Contact Us
  • Disclaimer
  • Privacy Policy
  • Terms and Conditions
© 2026 Crypto Flexs

Type above and press Enter to search. Press Esc to cancel.