
 Price Caught in a Bearish Trap: What’s Next?")
TIA, the native token of modular blockchain project Celestia, continues to struggle. It is currently trading at $5.32, down 12.37% over the past 30 days.
Over time, the indicators show that TIA may be escalating losses as it approaches a critical point. Here’s what to expect:
Celestia holders may have to deal with another downturn.
The daily chart shows a relative strength index (RSI) reading of 38.86. RSI is a technical indicator that measures the speed and price movements of a cryptocurrency. The oscillator also determines whether an asset is overbought or oversold.
If the reading is above 70.00, the asset is overbought. However, readings below 30.00 indicate oversold conditions. Therefore, a falling RSI on the Celestia chart indicates that the token is heading towards the oversold zone.
If the momentum reading continues to decline, the TIA price may continue to decline as well. This could lead to the cryptocurrency’s value dropping below $5.
Read more: 9 Safest Cryptocurrency Exchanges in 2024
As a result, the current state of cryptocurrencies has led traders in the derivatives market to maintain positions that support a bearish bias, as evidenced by the funding rates shown in the on-chain data.
The funding rate represents the difference between the cryptocurrency contract price and the spot price. A positive reading indicates bullish expectations from traders, while a negative reading indicates that the perpetual price is trading below the spot price, suggesting a bearish bias.
At the time of writing, TIA’s funding rate was in negative territory, reinforcing the idea that market participants do not expect a price rebound.
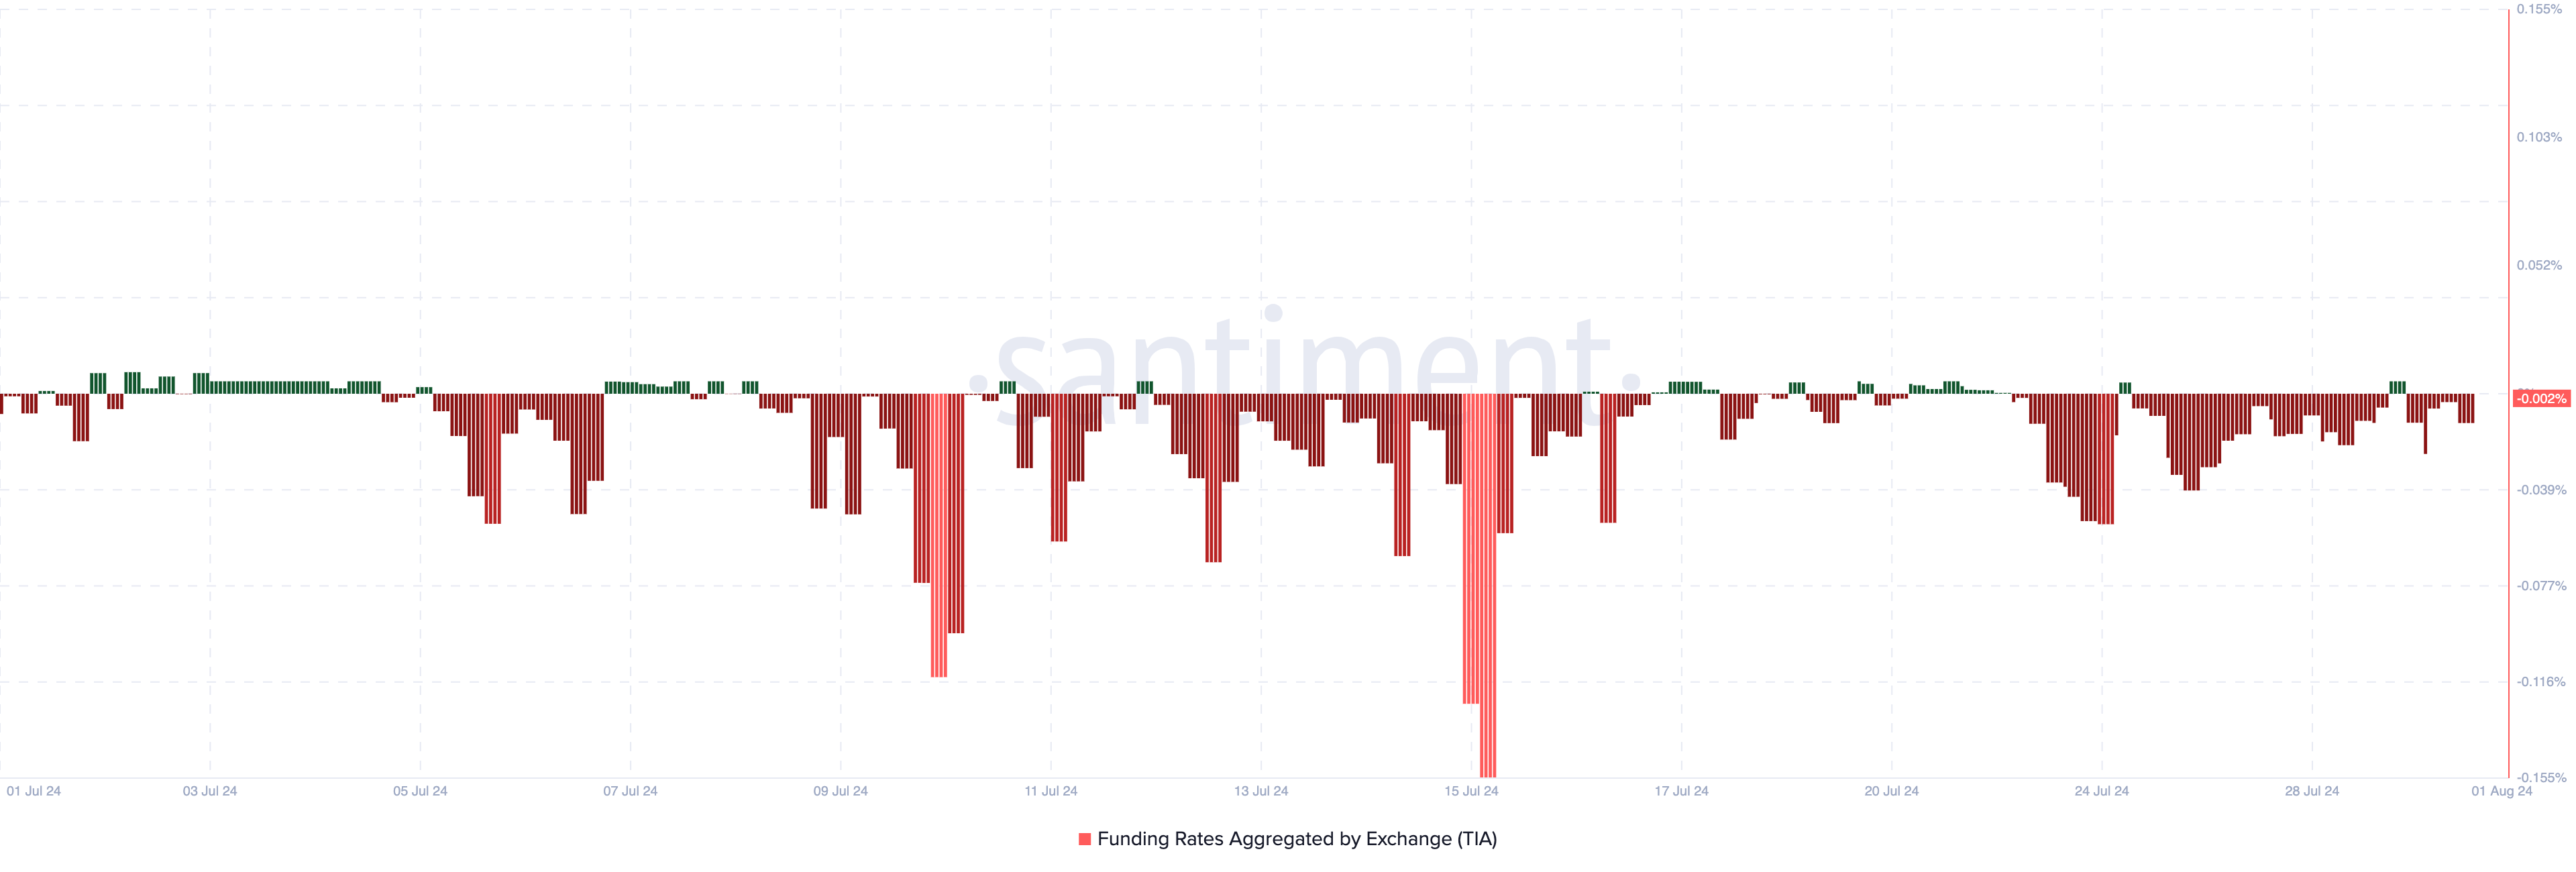
However, this is a phenomenon that has been present throughout the past month and reflects market-wide skepticism about TIAA in the short term.
TIA Price Prediction: Will Rising Liquidity Lead to a Rebound?
As of this writing, TIA has been trading within a descending triangle since July 22. In this pattern, prices continue to make lower highs while flat support lines consolidate around the same area.
This pattern is usually bearish and could lead to another breakdown if the token runs out of buying power. The Fibonacci correction indicator also gives an idea of where the price will go next as each ratio identifies support and resistance zones.
The most important Fib ratios are 23.6%, 38.2%, 61.8%, and 78.6%. In the chart below, the price of TIA has fallen below the 23.6% nominal pullback. If selling pressure increases, the value of TIA could fall to $4.13.
Read more: What are the best altcoins to invest in August 2024?
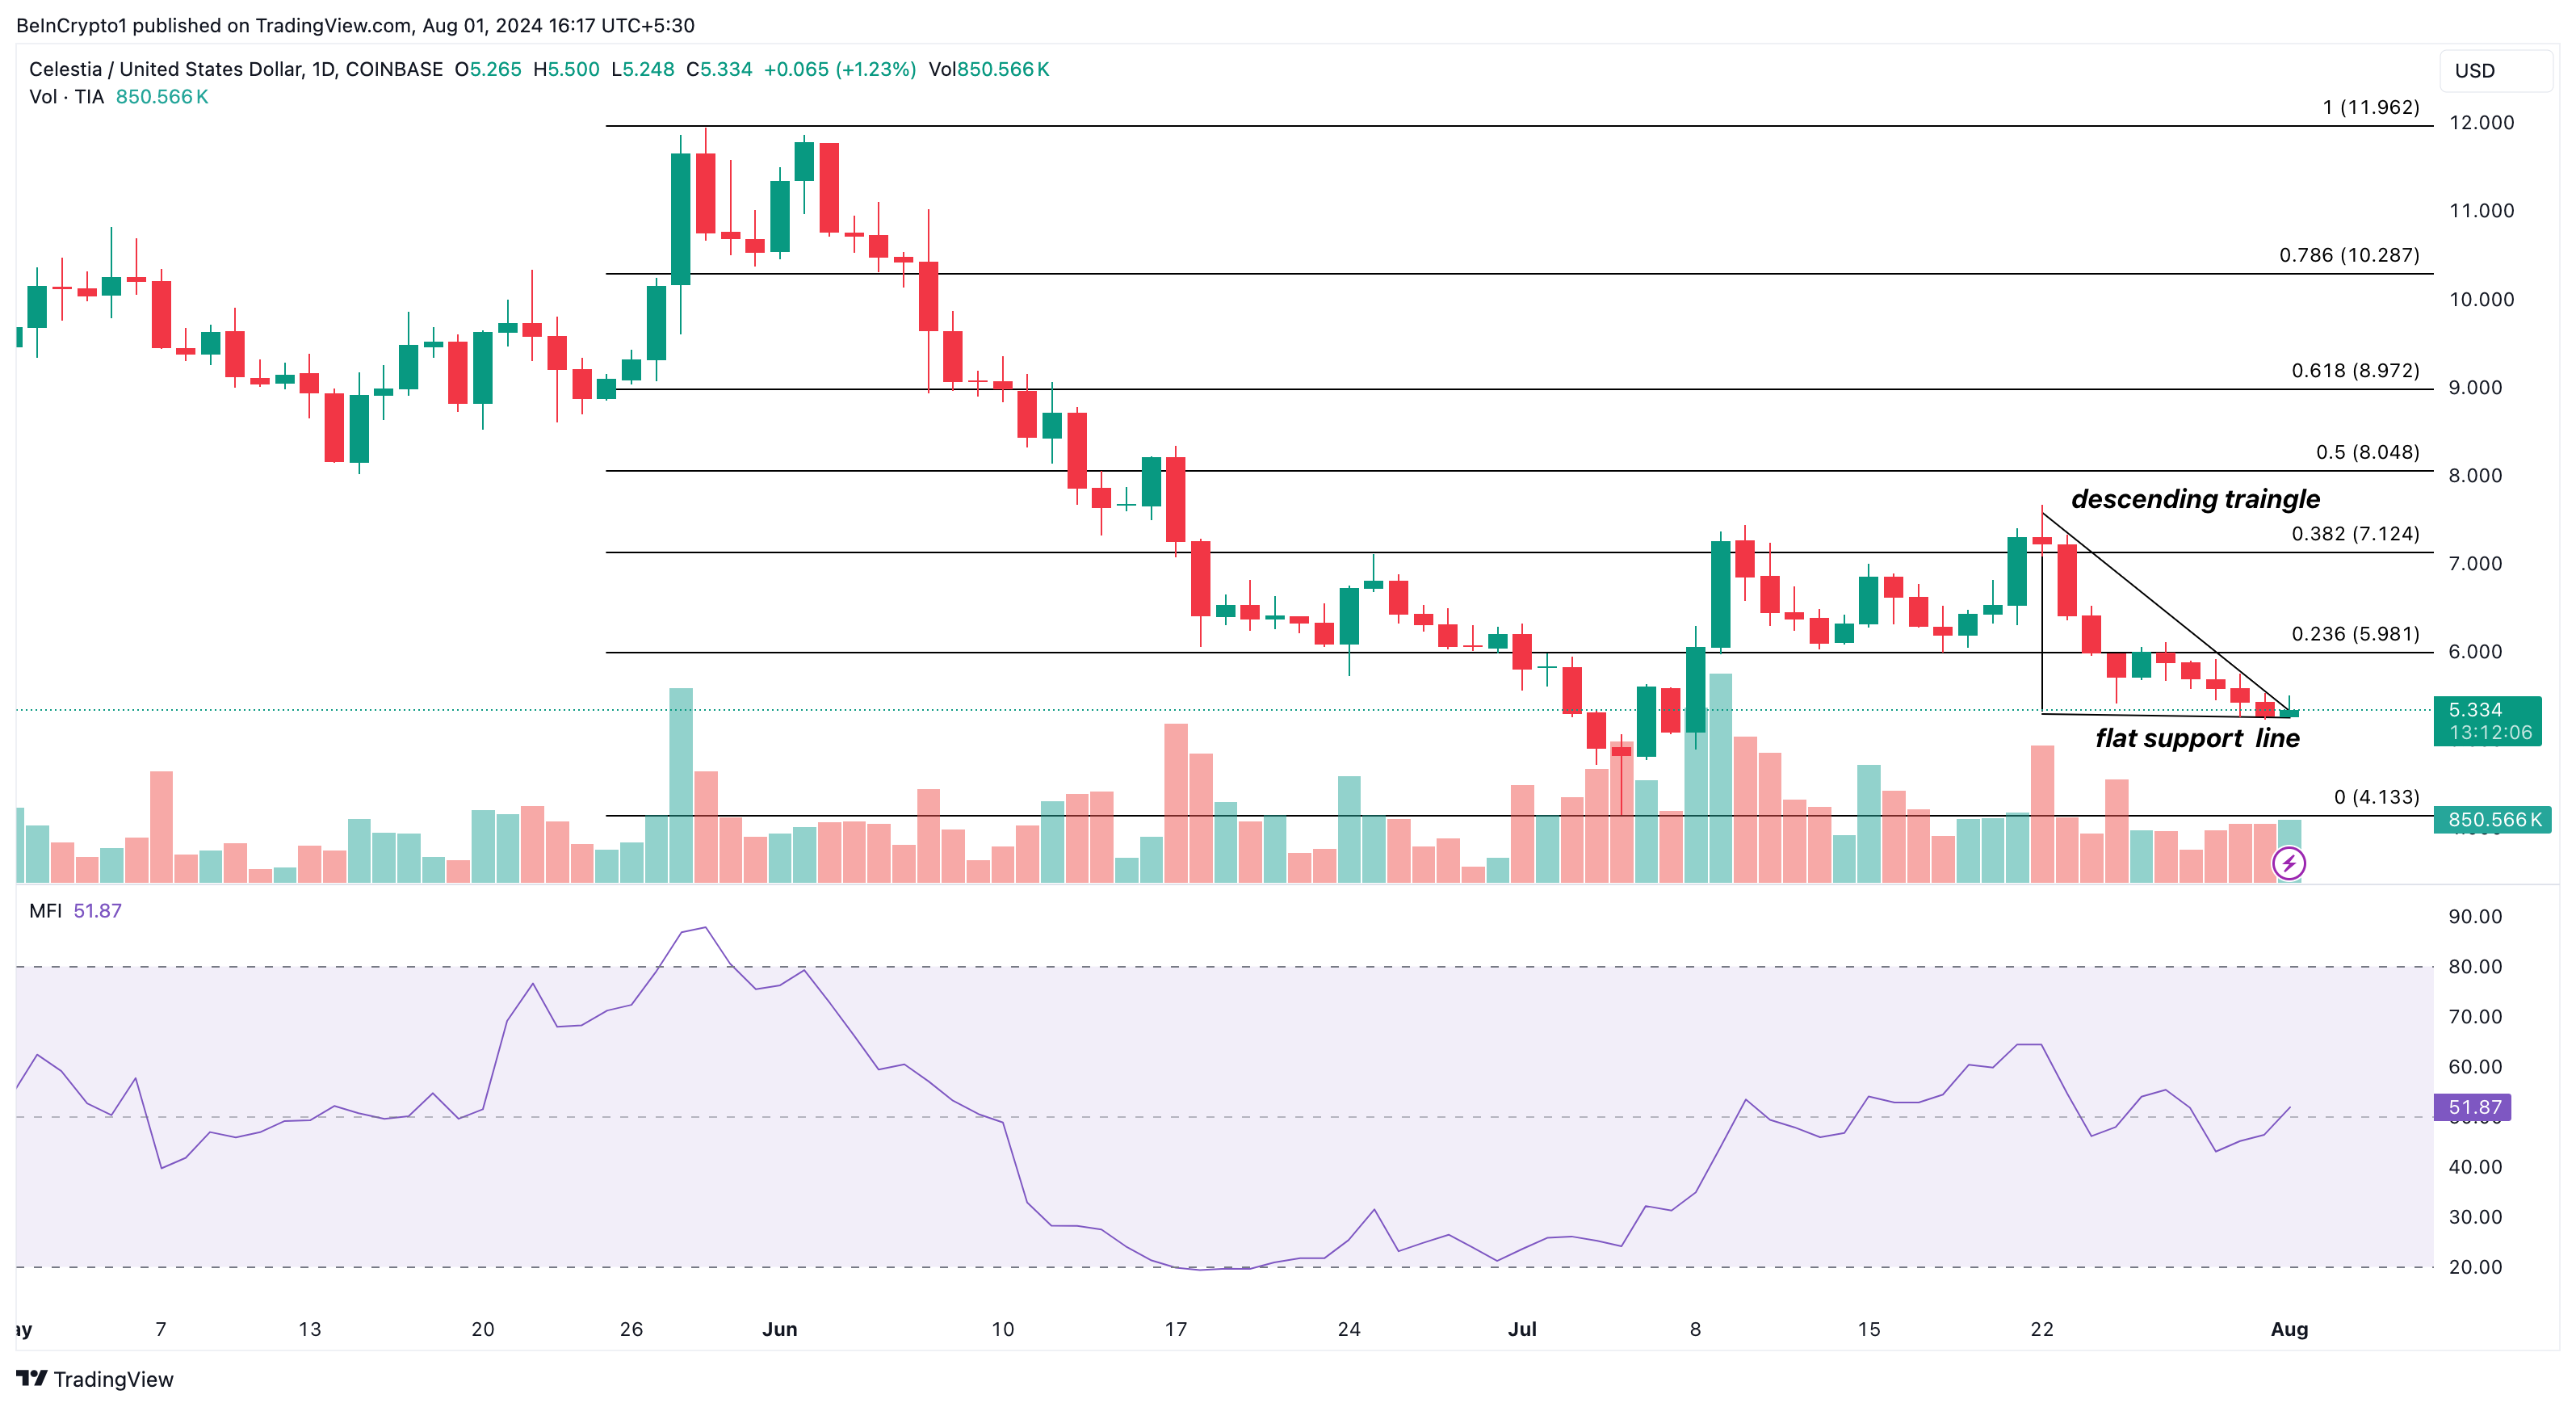
However, the Money Flow Index (MFI) shows that the Celestia token is starting to experience increased liquidity. If this continues, the price of TIA could bounce back to $5.98, invalidating the bearish theory.
disclaimer
In accordance with the Trust Project guidelines, this price analysis article is provided for informational purposes only and should not be considered financial or investment advice. BeInCrypto strives to provide accurate and unbiased reporting, but market conditions are subject to change without prior notice. Always conduct your own research and consult with a professional before making any financial decisions. Please be advised that our Terms of Use, Privacy Policy and Disclaimer have been updated.