Crypto Flexs
  • DIRECTORY
  • CRYPTO
    • ETHEREUM
    • BITCOIN
    • ALTCOIN
  • BLOCKCHAIN
  • EXCHANGE
  • TRADING
  • SUBMIT
Crypto Flexs
  • DIRECTORY
  • CRYPTO
    • ETHEREUM
    • BITCOIN
    • ALTCOIN
  • BLOCKCHAIN
  • EXCHANGE
  • TRADING
  • SUBMIT
Crypto Flexs
Home»ALTCOIN NEWS»Chainlink price prediction – Here is the rally on LINK chart:
ALTCOIN NEWS

Chainlink price prediction – Here is the rally on LINK chart:

By Crypto FlexsOctober 31, 20243 Mins Read
Facebook Twitter Pinterest LinkedIn Tumblr Email
Chainlink price prediction – Here is the rally on LINK chart:
Share
Facebook Twitter LinkedIn Pinterest Email
  • Chainlink appears to be closing in on the important $13.01 resistance within a symmetrical triangle.
  • Rising technical indicators and open interest indicate a possible breakout if resistance is breached.

Chainlink (LINK) It caught the attention of the cryptocurrency community after it started consolidating within a large symmetrical triangle pattern on the daily charts. This formation, often a sign of upcoming volatility, brings LINK closer to triangle resistance around $13.01. Violation of this critical level could unlock bullish momentum, fueling LINK’s next rally.

At press time, LINK was trading at $12.00 following a daily gain of 4.55%. Therefore, a decisive breakout here could validate the bullish outlook and create an interesting setup for traders waiting to see if LINK can break free and trigger a sustained upward trend.
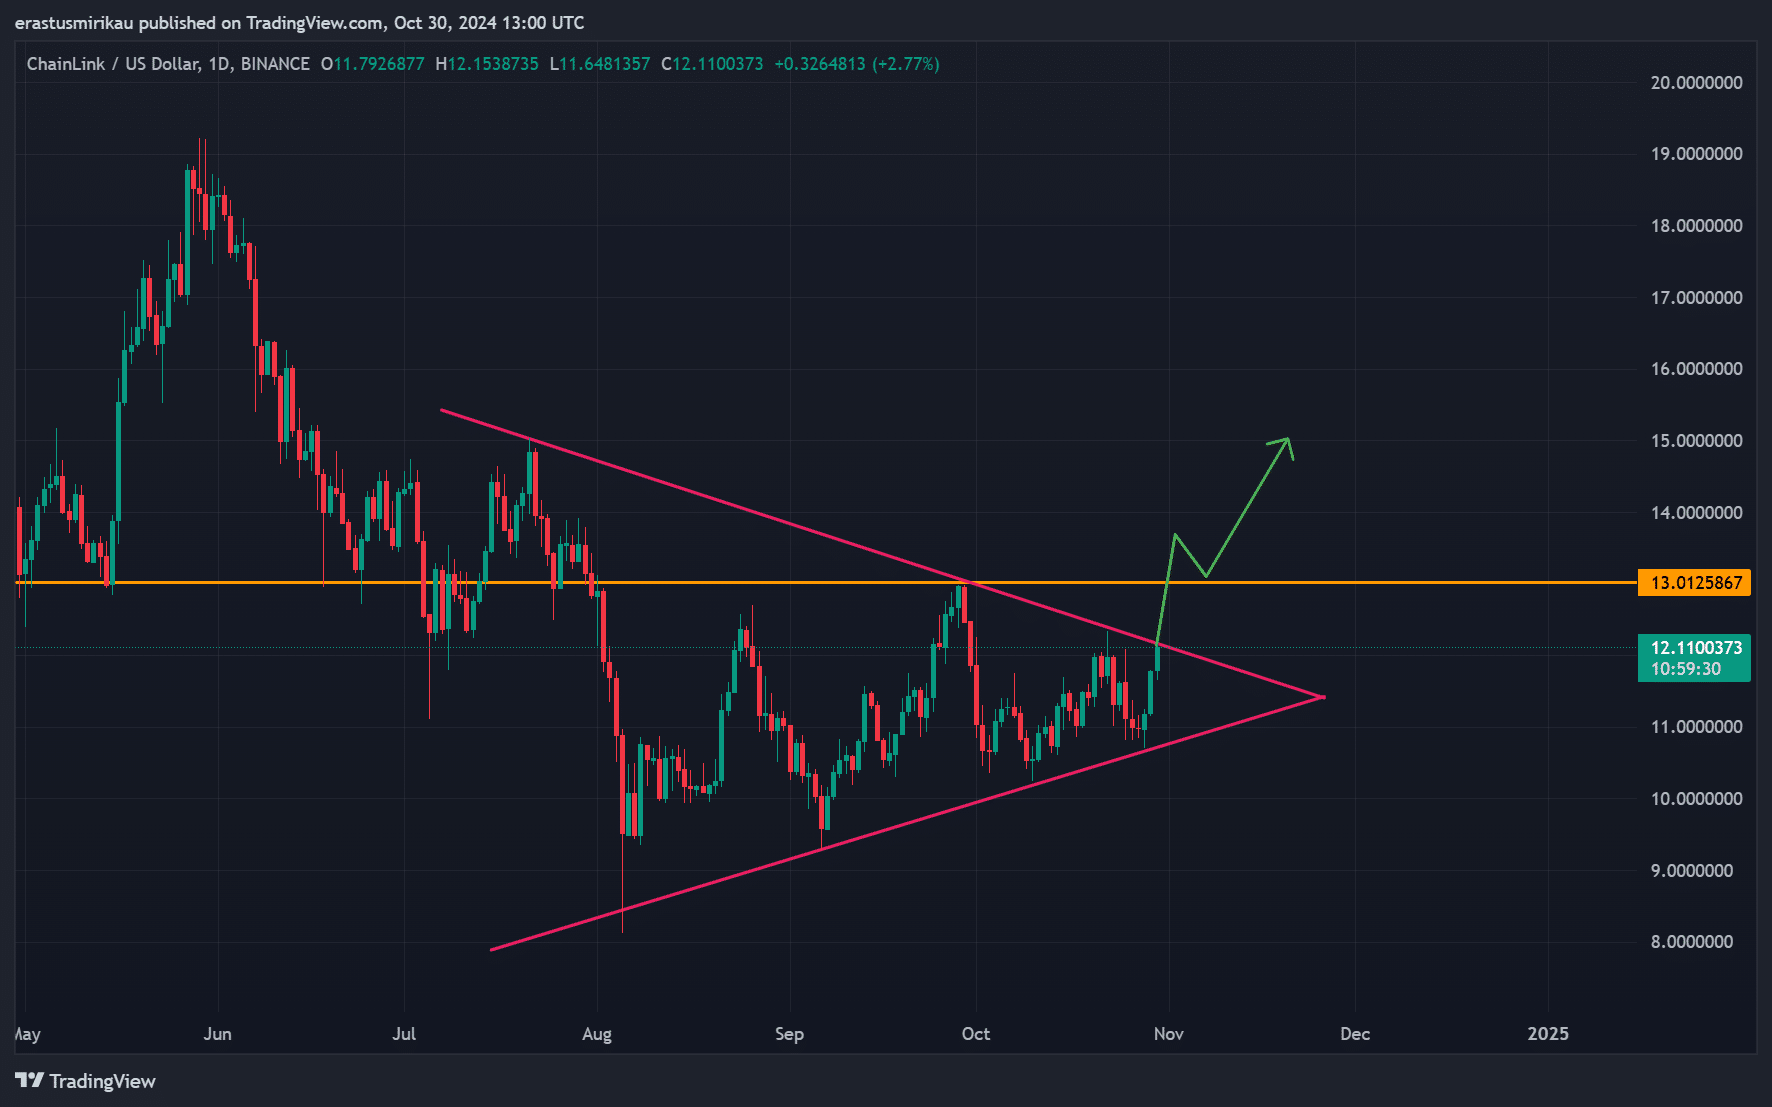
LINK chart analysis

Source: TradingView

Is the symmetrical triangle pointing to a bullish move?

However, the possibility of this breakout is not based solely on chart patterns, as several technical indicators have strengthened the bullish potential. The Bollinger Bands (BB) on the daily time frame are narrowing, indicating that volatility may be imminent. As LINK’s price rises towards the upper band of $12.12, a significant break above this level could confirm a shift to bullish momentum.

Additionally, the Stochastic RSI, which hit 64.21, remained below overbought territory, highlighting increasing buying pressure.

As a result, this means that LINK has room to continue rising before it reaches serious resistance on the charts.
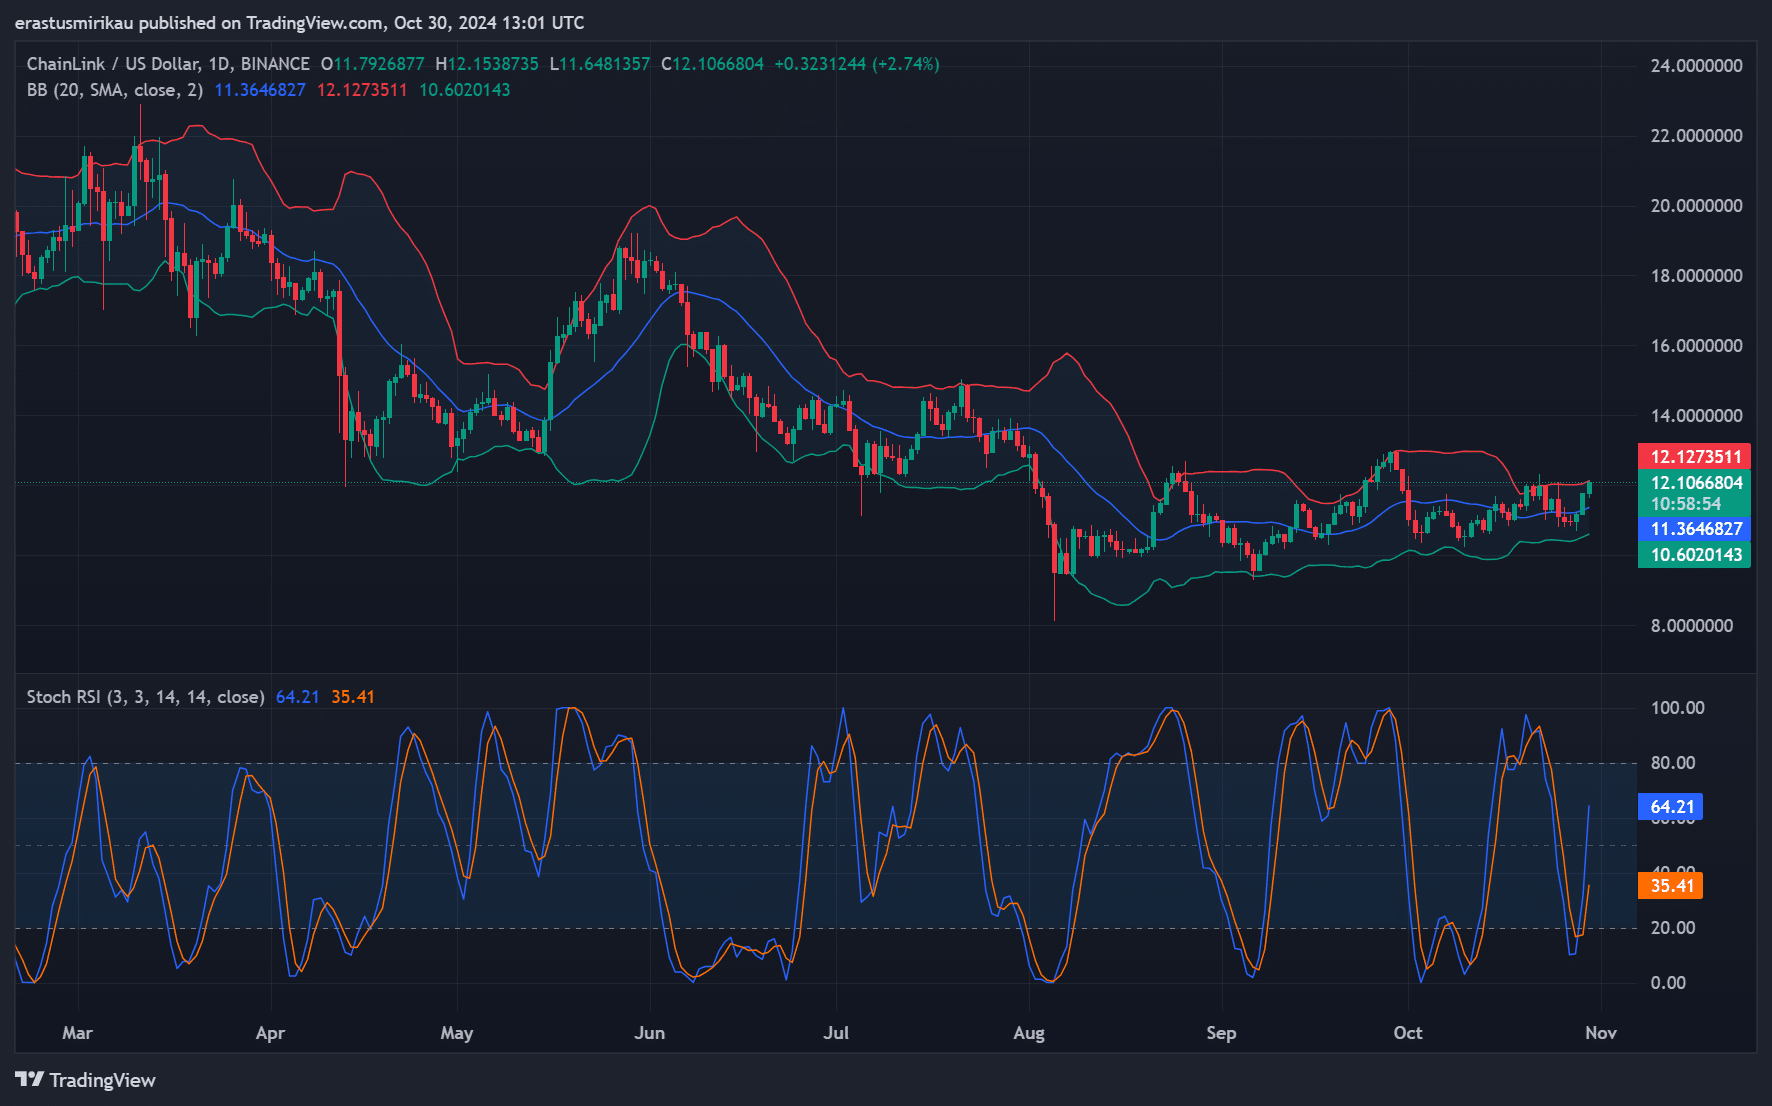
LINK technical analysisLINK technical analysis

Source: TradingView

What does the LINK on-chain signal say?

Additionally, on-chain indicators provided supporting data showing a steady increase in network activity consistent with potential upward momentum. Active addresses increased by 1.03% in the last 24 hours. This increase in user engagement is often tied to price strength. This is because increased activity often reflects growing interest in LINK.

Additionally, the number of transactions increased by 0.63%, indicating consistent network usage. This is a sign that interest in LINK remains robust. These indicators highlighted a healthy network backdrop as LINK approached breakout levels.

Source: CryptoQuant

Will a surge in open interest spur a breakout?

Lastly, open interest in LINK futures surged 13.14% to $274.29 million. The same price increase highlights that more traders are taking positions in the LINK market in anticipation of a decisive move.

Such uptrends are often seen as a sign of confidence, with market participants expecting meaningful price movements in the near term. Therefore, LINK appears to be well positioned for a potential breakout if it can break the $13.01 level, with both technical and on-chain signals consistent.
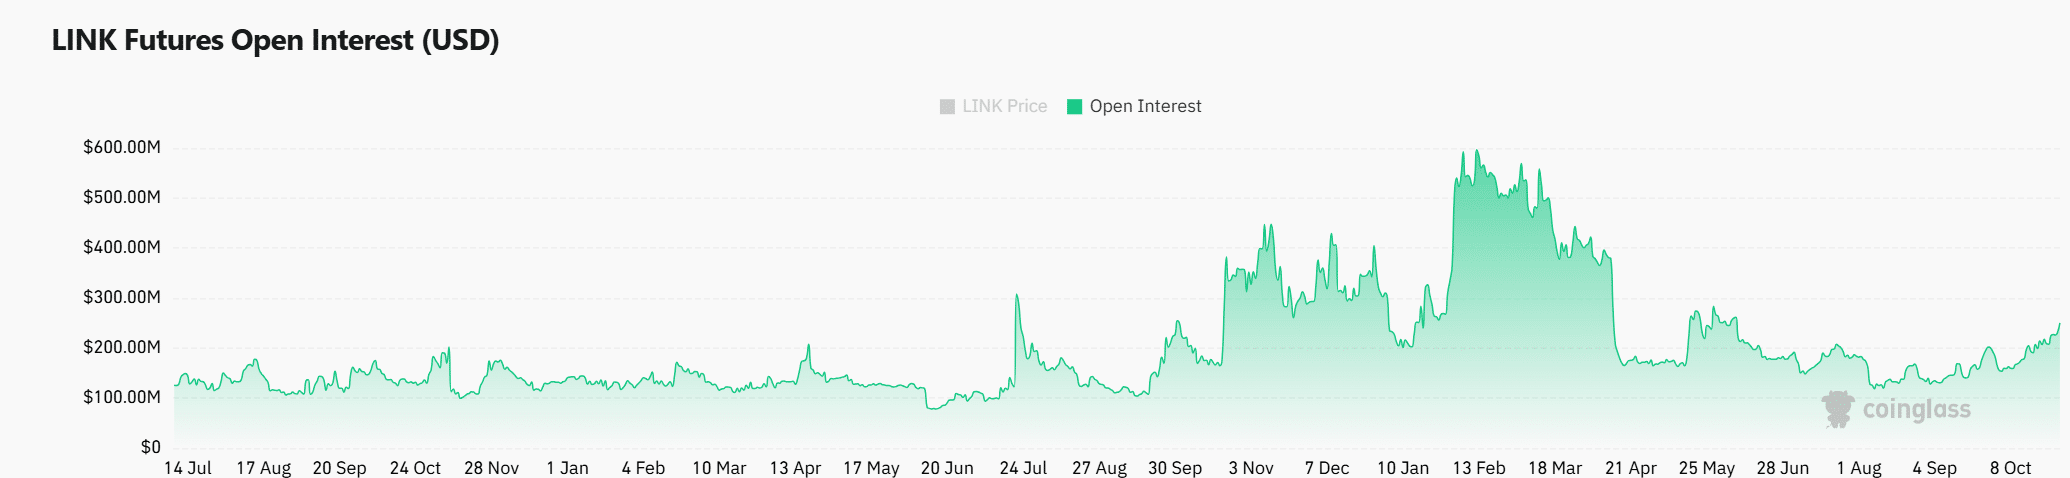
Source: Coinglass


Read Chainlink’s (link) price prediction for 2024-2025


Will LINK Breakout and Spark a Rally?

Chainlink’s charts, indicators, and on-chain indicators were all hovering near the $13.01 resistance level, hinting at a key moment. Supported by bullish momentum due to technical patterns and increasing network participation, Chainlink is poised for an upward move.

However, only a clear break above this resistance level will confirm Chainlink’s bullish direction. Can LINK finally break through and ignite the rally its supporters have been hoping for? The answer will come over the next few days.

Previous: Ethereum Breakout Probability – Here’s What Traders Should Pay Attention To!

Next: Jupiter (JUP) Cryptocurrency Price Prediction – Assessing the probability of a drop to $0.7

Share. Facebook Twitter Pinterest LinkedIn Tumblr Email

Related Posts

Crypto Market Rebound, L2 Surge and ZEC Shock: Daily Insights

October 16, 2025

The throat is falling, but the jupnet and ajup spark recovery reduce the potential

October 2, 2025

The method of transforming ASTER WHALES into panic is as follows.

September 25, 2025
Add A Comment

Comments are closed.

Recent Posts

MEXC Celebrates ZEROBASE (ZBT) Listing With Airdrop+ Event Featuring 55,000 USDT Prize Pool

October 16, 2025

How MasterQuant’s AI Trading Bot Is Becoming Every Investor’s Favorite Trade Machine

October 16, 2025

Seascape Launches First Tokenized BNB Treasury Strategy On Binance Smart Chain

October 16, 2025

ETH And BTC Holders Are Flocking To OAK Mining For Stable Profits Of $8,600 Daily

October 16, 2025

Will Solana price fall to $170 once it gets close to the important support level?

October 16, 2025

Crypto Market Rebound, L2 Surge and ZEC Shock: Daily Insights

October 16, 2025

ZBCN is tradable!

October 15, 2025

Analysts expect a breakout of $135 as ETF approval buzz grows.

October 15, 2025

Chinese woman pleads guilty ahead of trial in $7 billion British Bitcoin fraud case

October 15, 2025

XMoney Launches $XMN On Sui, Expands Listings Across Global Exchanges

October 15, 2025

ZNB) STRENGTHENS BALANCE SHEET WITH USD 231 MILLION BITCOIN-BACKED INVESTMENT AMID MARKET TURBULENCE

October 15, 2025

Crypto Flexs is a Professional Cryptocurrency News Platform. Here we will provide you only interesting content, which you will like very much. We’re dedicated to providing you the best of Cryptocurrency. We hope you enjoy our Cryptocurrency News as much as we enjoy offering them to you.

Contact Us : Partner(@)Cryptoflexs.com

Top Insights

MEXC Celebrates ZEROBASE (ZBT) Listing With Airdrop+ Event Featuring 55,000 USDT Prize Pool

October 16, 2025

How MasterQuant’s AI Trading Bot Is Becoming Every Investor’s Favorite Trade Machine

October 16, 2025

Seascape Launches First Tokenized BNB Treasury Strategy On Binance Smart Chain

October 16, 2025
Most Popular

US Spot Bitcoin ETFs See $92 Million Inflows, BTC Slightly Down

September 23, 2024

The SEC is in court again

January 20, 2024

Data shows that Ethereum whales have been selling non-stop for six months.

October 12, 2024
  • Home
  • About Us
  • Contact Us
  • Disclaimer
  • Privacy Policy
  • Terms and Conditions
© 2025 Crypto Flexs

Type above and press Enter to search. Press Esc to cancel.