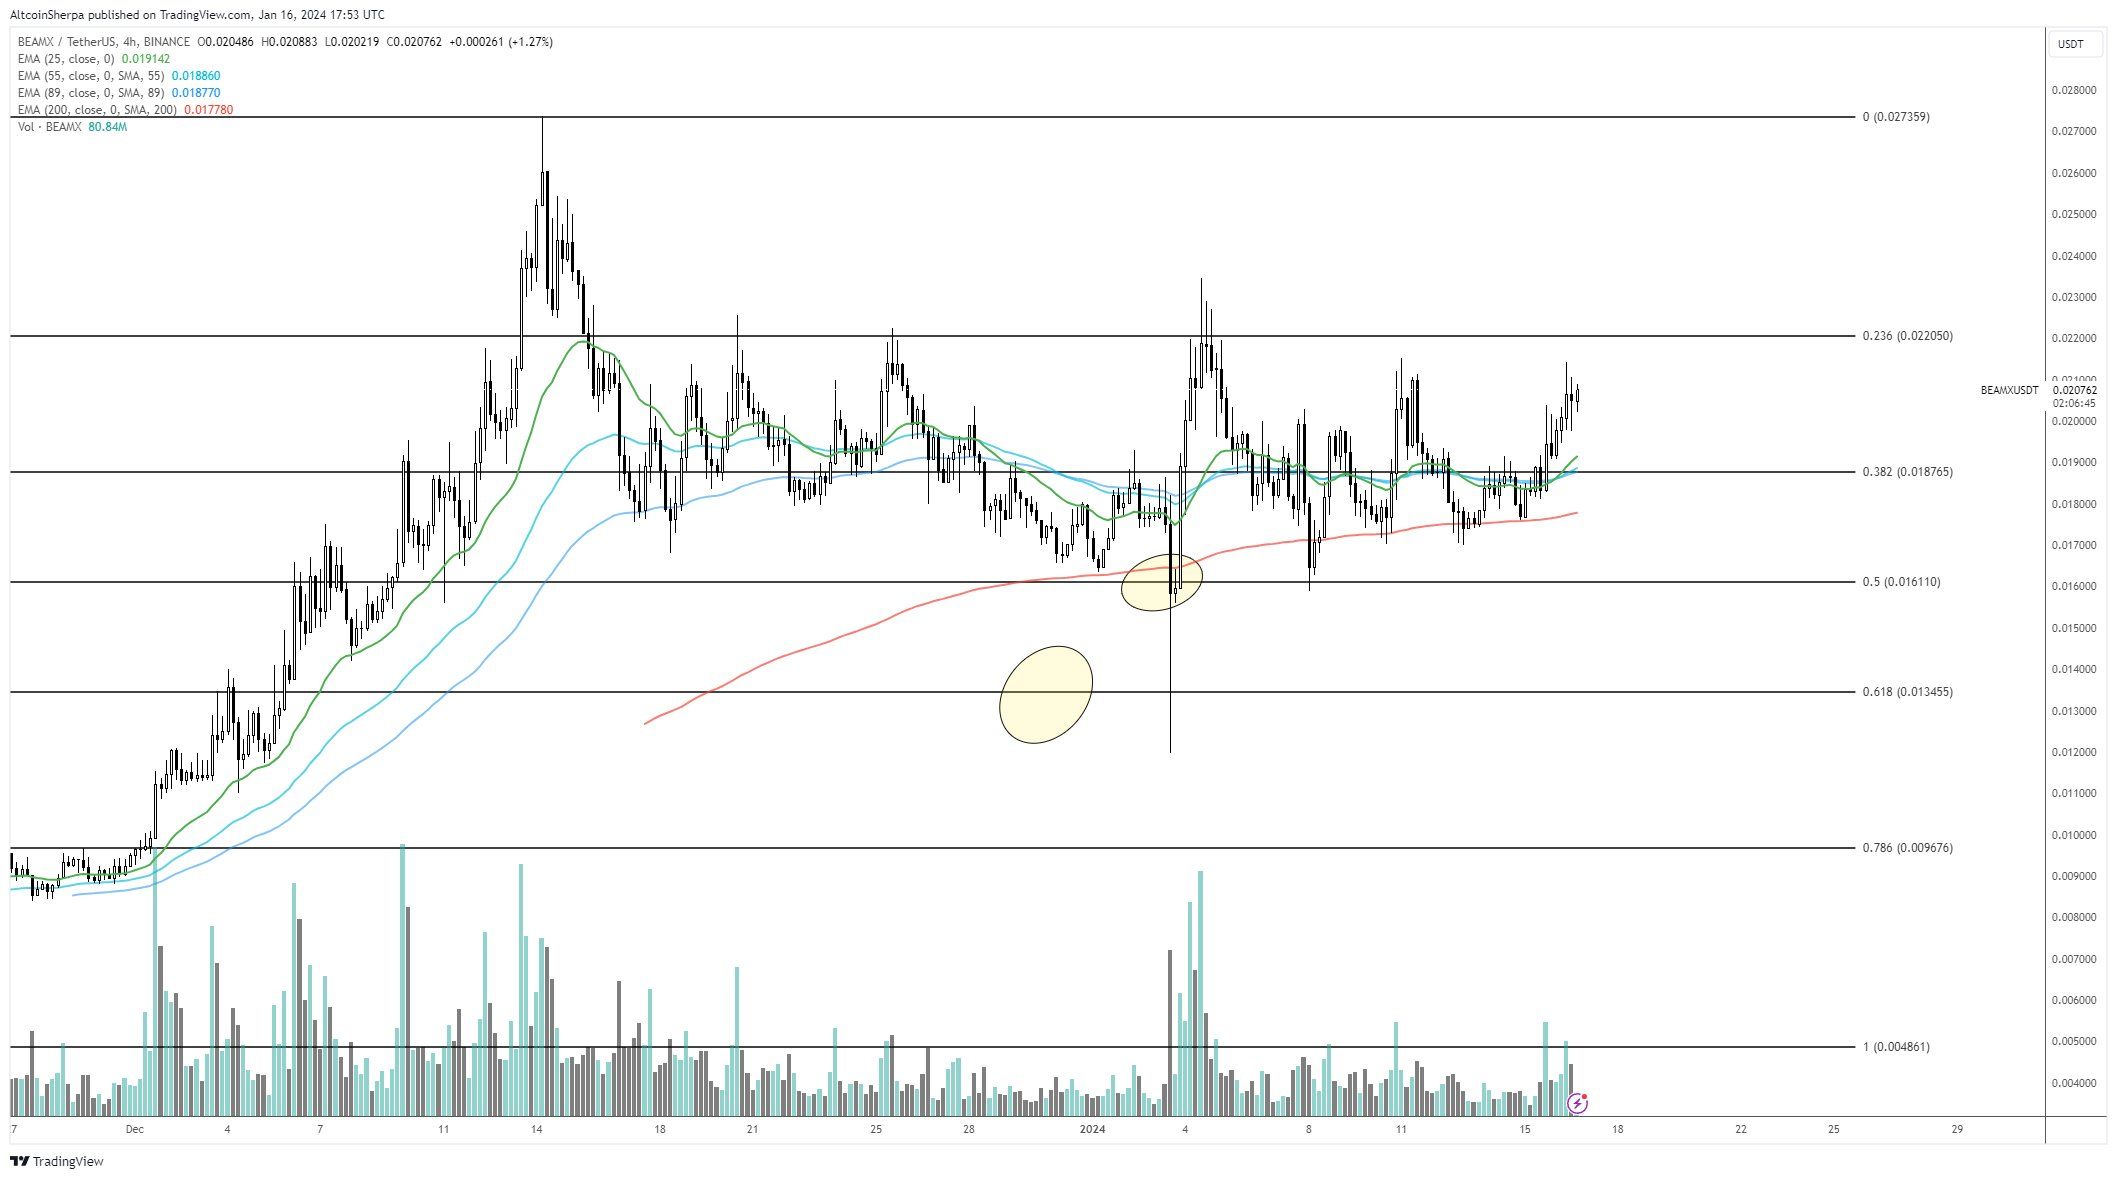
The BEAM price hit an all-time high of $0.027 on December 14, 2023, and has since gradually declined.
Despite the decline, prices stabilized again in 2024, breaking away from their long-term pattern.
BEAM attempt breakout
The daily time frame chart shows that BEAM price fell to a low of $0.012, creating a bullish hammer candlestick (green icon) on January 3rd. The price has since increased.
BEAM hit a higher low on January 14th and then accelerated its rate of increase, creating an upward support trendline. Today it is forming a third bullish candle, breaking out of a horizontal resistance zone that has been there for almost a month.
The daily RSI is also showing an upward trend.
RSI is a momentum indicator that traders use to assess whether the market is overbought or oversold and whether to accumulate or sell.
A reading above 50 and an upward trend indicates that the bulls still have the upper hand. Numbers below 50 indicate the opposite. The indicator moves above 50 (green circle) during a rebound, indicating a bullish trend.
Read more: Top 12 Crypto Companies to Watch in 2024
What do analysts say?
Cryptocurrency traders and analysts at X are resolutely optimistic about the future BEAM trend.
Altcoin Sherpa believes altcoins are one of his biggest bets in 2024 and will go much higher.

Godel said there could be much more upside ahead, citing the breakout of a long-term descending resistance trend line. He tweeted:
The diagonal line is broken.
Is the S/R flip signal likely to rise further? Clueless and difficult to predict in the short term (fool’s errand). But I have a feeling these numbers will soon be much higher.
finally, whyakuza urged his followers to “HODL” as the rising movement began.
Read more: 15 Best Penny Cryptocurrencies to Invest in January 2024
BEAM Price Prediction: Record High?
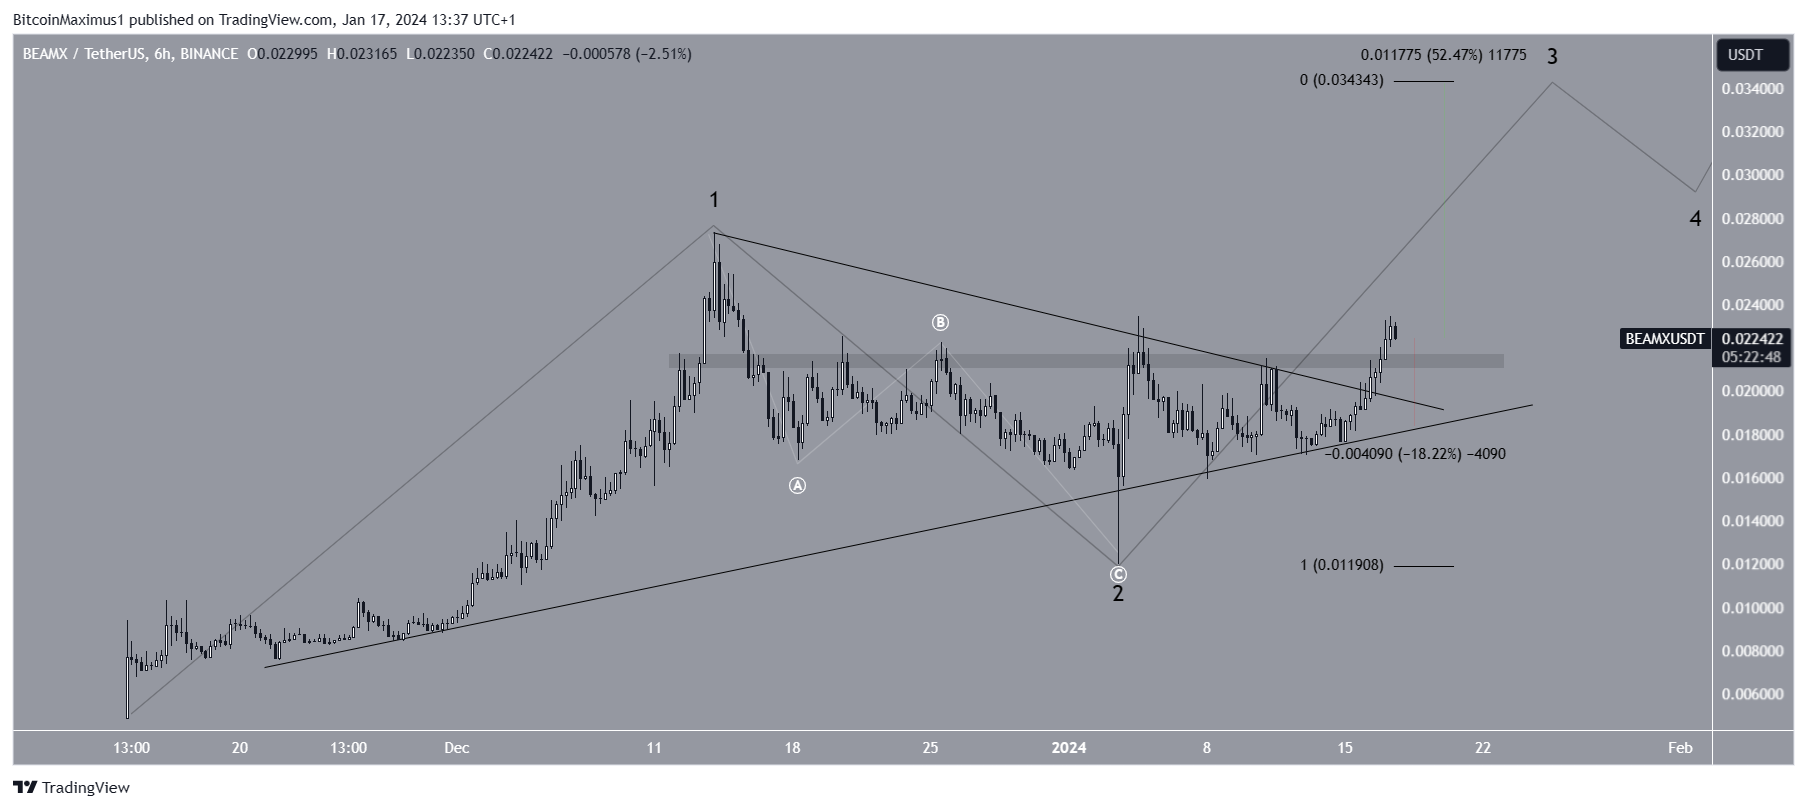
Short-term 6-hour technical analysis provides a bullish outlook due to price action and number of waves.
Technical analysts utilize Elliott Wave Theory to identify trend direction by studying recurring long-term price patterns and investor sentiment. The most likely wave number indicates that BEAM is in wave 3 with a 5 wave increase (black). This is evident from the corrective ABC structure inside wave 2 (white).
The price action supported the altcoin’s strength, breaking out of the long-term symmetrical triangle and reclaiming the horizontal area at $0.022. A 1:1 ratio for waves 1 and 3 could increase the next resistance at $0.034 by 50%.

Despite this optimistic BEAM price prediction, a close below $0.022 could result in a 20% decline in the upward support trend line at $0.018.
Click here to view BeInCrypto’s latest cryptocurrency market analysis.
Read more: Top 10 Cheapest Cryptocurrencies to Invest in January 2024
disclaimer
In accordance with Trust Project guidelines, this price analysis article is provided for informational purposes only and should not be considered financial or investment advice. BeInCrypto is committed to accurate and unbiased reporting, but market conditions may change without notice. Always do your own research and consult with a professional before making any financial decisions. Our Terms of Use, Privacy Policy and Disclaimer have been updated.

