

- Bitget Token, XDC Network, and XRP saw the biggest gains this week.
- AI16Z, ThorChain, and Virtuals Protocol suffered the biggest losses over the past week.
Cryptocurrency markets had another action-packed week of trading, with several tokens putting up impressive rallies while others faced significant selling pressure. As institutional interest continues to drive market dynamics, let’s take a look at some of the most notable price movements that shaped the trading environment this week.
biggest winner
BitGet Token (BGB)
BGB was a standout performer of the week, surpassing expectations with a notable surge from $6.011 to $7.137. The token’s journey has been particularly eye-catching since its November breakout, breaking through previous resistance points and continuously setting higher lows.
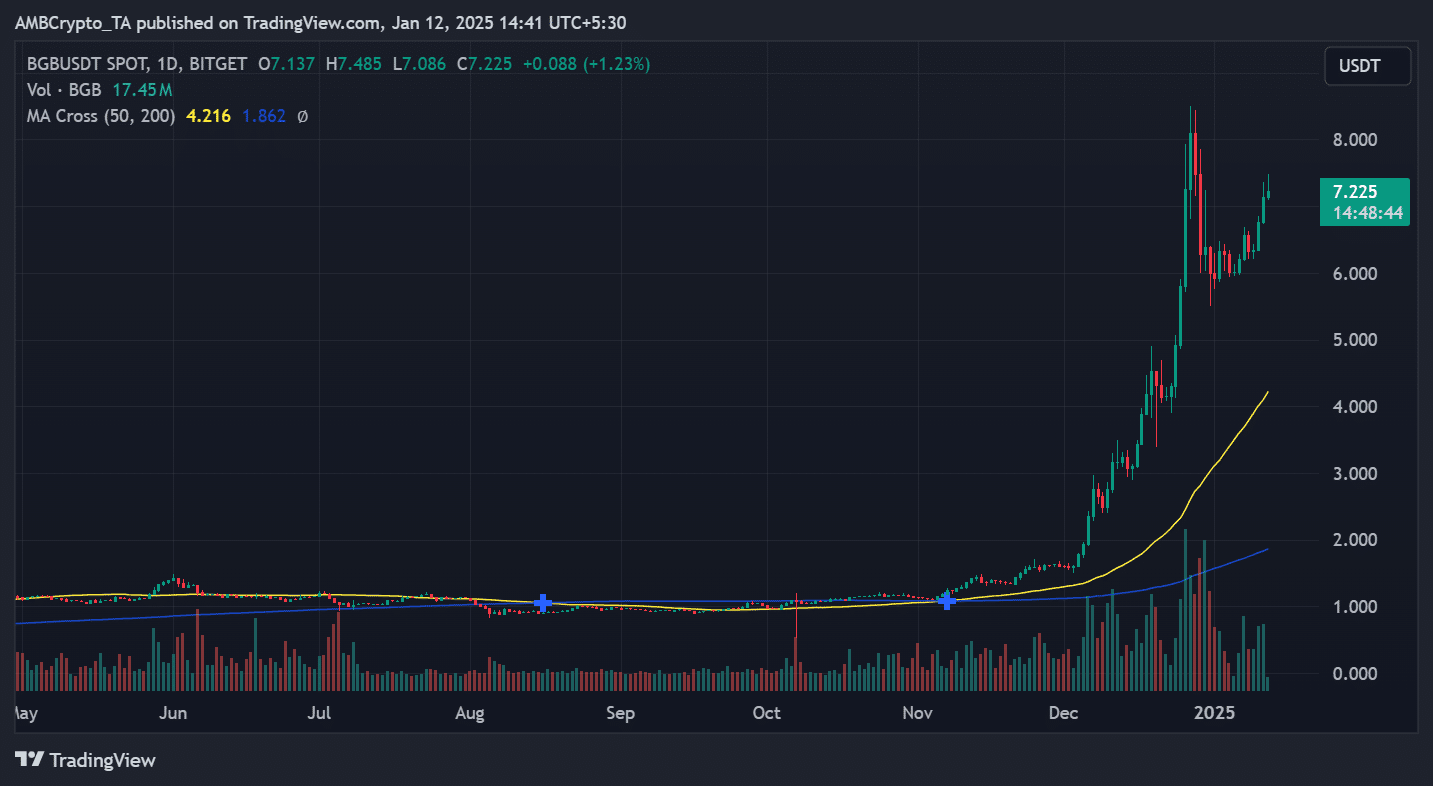
Source: TradingView
December saw a sharp increase in trading activity, with volumes soaring along with prices. This is a clear sign that market confidence is increasing. Well above its moving average of $7.225, BGB maintained strong bullish momentum, which is reflected in its 20% weekly gain. The chart showed a textbook golden cross pattern, traditionally a reliable indicator of a sustained uptrend.
While steep price increases may raise eyebrows, the steady increase in trading volume suggested genuine market interest rather than speculative frenzy.
However, traders should watch closely for potential consolidation steps that often follow these dramatic gains. The token’s performance is even more remarkable when considering broader market conditions, showing it to be one of the most resilient assets in a typical trading environment.
XDC Network
XDC’s impressive rally continues to draw attention, with the stock gaining a solid 12%, making it the second best performer of the week. The token broke the important $0.10 mark, rising from $0.0968 to $0.101. This represents surprising strength in a typically volatile market.
Trading volume remains at a good level at 820.55K XDC, suggesting continued market interest rather than short-term speculation. At the time of writing, data shows trading volume was around $53.7 million, up more than 5% in the last 24 hours. An upward trend was also visible on the chart, proving the bullish momentum.
XDC also appears to maintain a comfortable position above both the 50-day and 200-day moving averages, with the current daily movement of -0.66% indicating slight profit-taking.
XRP
Despite a shaky start around $2.3, XRP surged dramatically late in the week, earning it a spot among the week’s top performers. The altcoin’s fortunes took a sharp turn on January 11, when a 10% rise sent its price skyrocketing to $2.50. However, at the time of reporting, it was down to $2.4953 (-3.13%).
Trading volume remained strong at 52.94M XRP, indicating significant market participation during the rally. XRP is comfortably above key moving averages of 2.2409 (50 days) and 1.0037 (200 days) and appears to be maintaining a long-term bullish structure despite recent volatility.
The chart also tracks the robust recovery in November, setting the stage for a dominant upward trajectory.
biggest loser
AI16Z (AI16Z)
AI16Z suffered the most this week, plummeting from $1.8 to $1.1 in a dramatic sell-off that saw it lose more than 37% of its value. The token briefly teased investors with a sharp 20% rally that pushed the price above $2, but faced relentless selling pressure throughout the rest of the week.
At press time, trading volume for the token, trading at $1.1688 with a slight increase of +0.76%, reached 239 million. The data highlighted a decline of more than 29% in the last 24 hours, reflecting intense market activity during the downturn.
The charts painted a picture of extreme volatility, with tokens recording wild price swings, a hallmark of markets struggling to find stable footing. The lack of a clear support level after the recent steep decline suggested further volatility ahead.
TorChain (RUNE)
RUNE’s brutal selling continued this week, with its worst performance yet, down an astonishing 33%. Opening at around $4.90, the token faced constant selling pressure that accelerated as the week went on, eventually causing the price to drop to $3.395 (-1.48% daily).
Trading volume hit 3.71 million RUNE, highlighting the strength of this downward movement. The technical picture looked particularly bleak as the token broke both its 50-day and 200-day moving averages (5.496 and 4.734, respectively), erasing months of gains in a matter of days.
Lastly, a sharp reversal from the December high signals a significant shift in market sentiment, with a break below key support levels likely increasing the likelihood of further declines.
Virtual Protocol (Virtual)
VIRTUAL’s recent price action clearly showed that market confidence is deteriorating, with the token recording a sharp 31% decline this week. The token, which opened around $4, immediately faced selling pressure and fell 9% in the early trading session. Trading at $2.8246 after falling 5.53% for the day, VIRTUAL’s chart highlighted continued selling interest.
The technical setup appears to be particularly worrisome as the price has fallen below several key support levels at press time.
The MACD indicator (-0.2113) turned significantly negative, confirming strong bearish momentum. This bearish crossover in the MACD highlighted the likelihood of continued downward pressure in the near term.
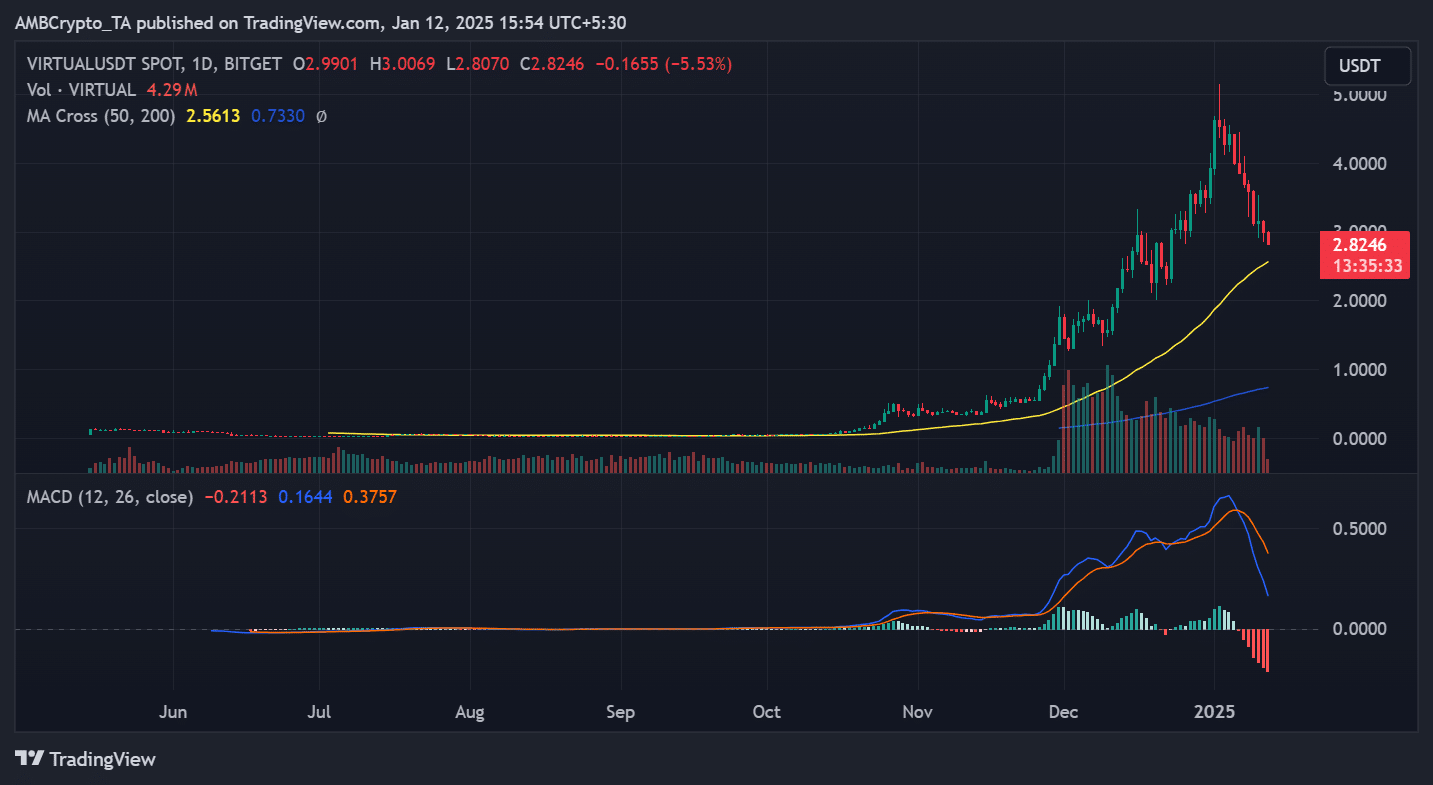
Source: TradingView
Looking at the moving averages, VIRTUAL was trading well below both the 50-day moving average (2.5613) and the 200-day moving average (0.7330), but the long-term uptrend structure remained intact considering the price was still above the 200-day MA. . The volume profile during this downtrend shows increased sell-side participation, especially in recent sessions.
The sharp decline from the December high suggests a capitulation phase, but the lack of a clear bottom pattern makes it difficult to identify reliable support levels. Price movements from November to December formed an explosive peak, and the current decline potentially represents a corrective phase in that pattern.
For a potential recovery, the token would need to regain its 50-day MA as support. In fact, immediate price action suggested that further consolidation is likely before a meaningful rebound occurs.
conclusion
Here’s a weekly recap of who gained the most and who lost the most. It is important to keep in mind the volatile nature of the market, where prices can change quickly.
Therefore, it is best to do your own research (DYOR) before making any investment decisions.