

Ethereum (ETH) fell 3.4% to $2,287 on Monday after its fourth rejection at the $2,400 level since April 14. Prices continue to trade below the 100-day moving average, with liquidation risk of more than $2.5 billion concentrated near the $2,150 support zone.
Cryptocurrency analyst Michael van de Poppe also pointed out Ethereum’s weakness compared to Bitcoin, raising doubts about the strength of the short-term upward trend.
ETH repeats rejection at $2,400 upper limit
Ethereum has failed to break above $2,400 four times in the past two weeks, forming a clear triple top pattern on the daily chart. Each time it is retested, the strength decreases near that level, indicating that sellers have been absorbing supply.
The 100-day exponential moving average (EMA) near $2,350 continues to act as dynamic resistance. The attempt to rise was short-lived as the price failed to hold above that on the daily chart.
ETH/USDT on 1-day chart. source: Cointelegraph/Trading View
Support at $2,150 now holds more weight. This level has previously acted as resistance and may be tested based on it in the coming days. A move below that opens the door to deeper bearish levels.
Liquidation data is putting pressure on this area, with $2.5 billion of leveraged buys sitting below $2,150. A drop below this level could trigger a forced sell in the $2,050-$1,900 range.
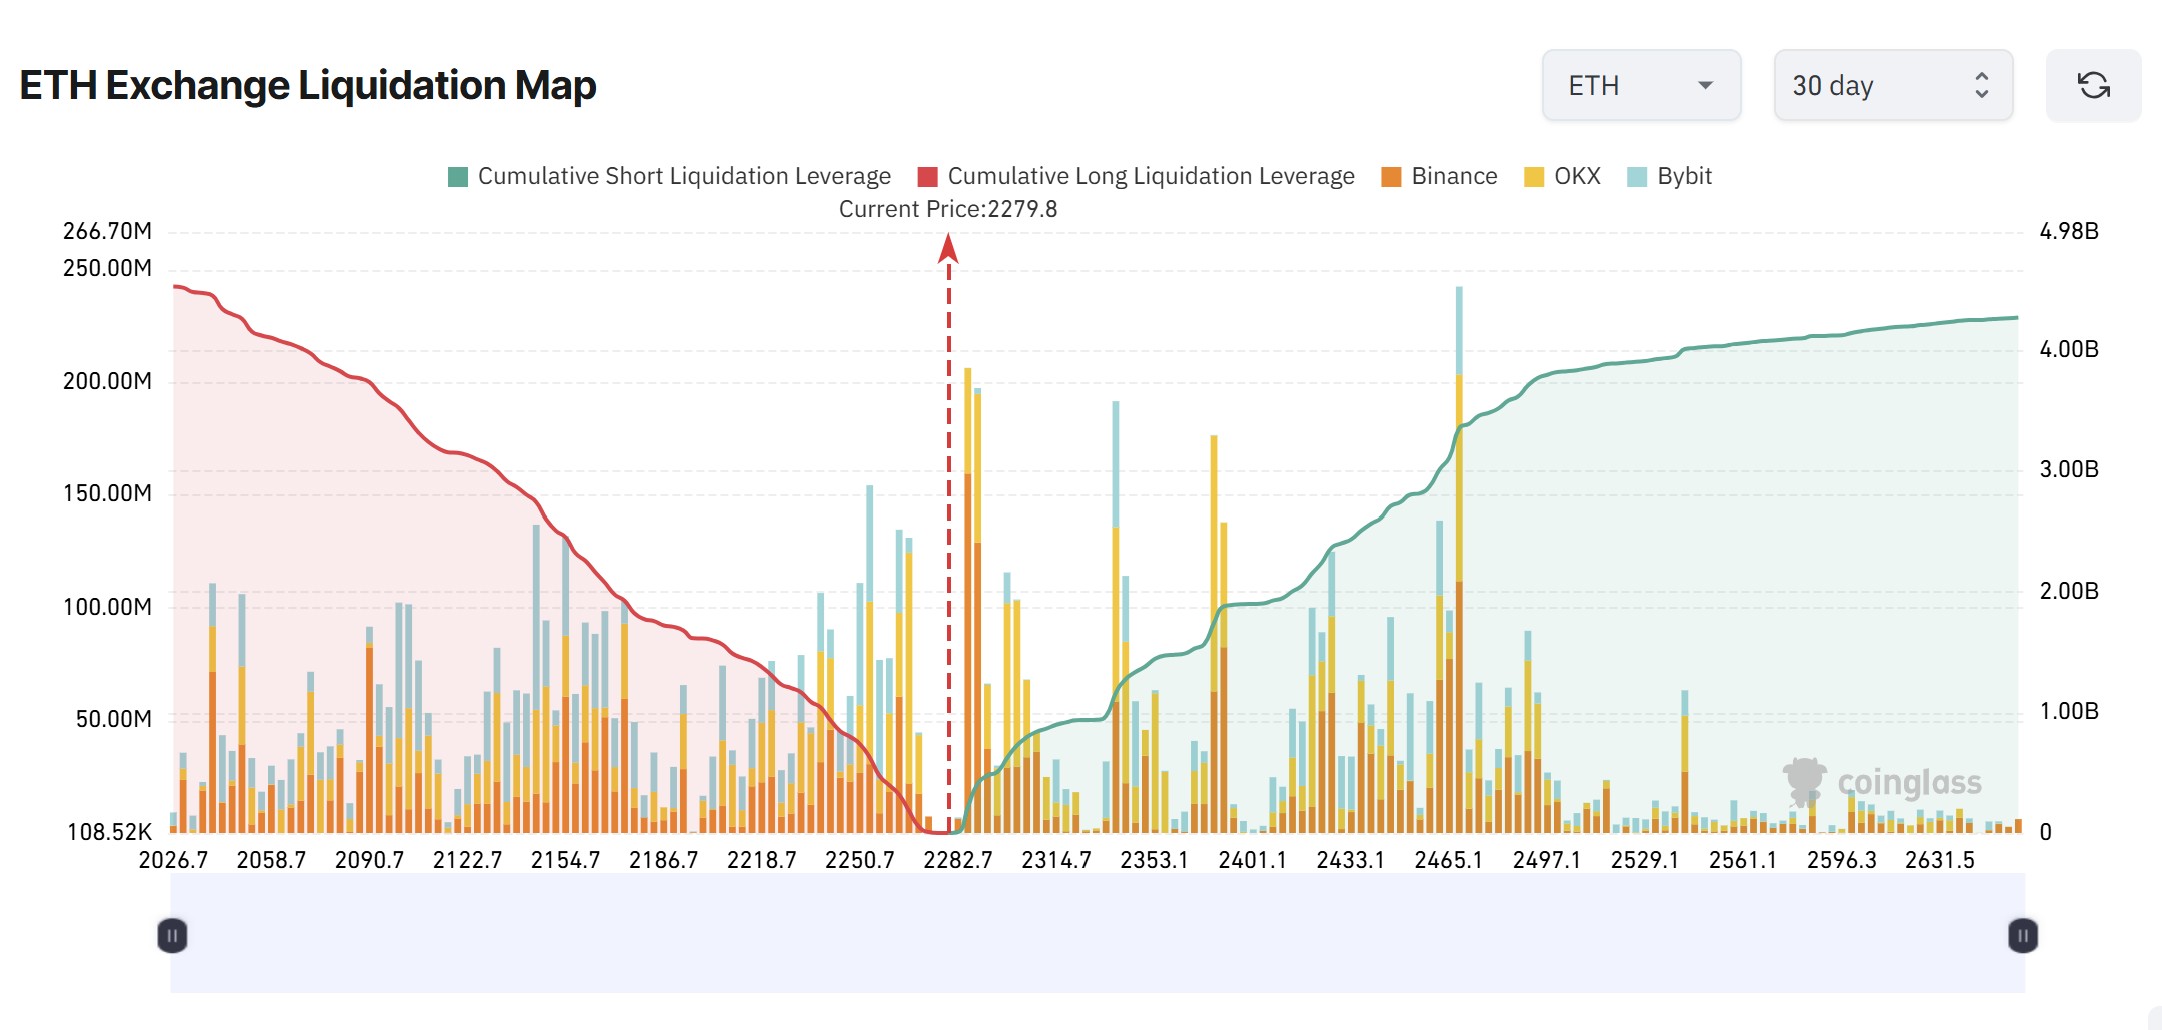
Ether liquidation map. Source: Coinglass
MN Capital founder Michaël van de Poppe pointed out the weakness of the ETH/BTC pair. As the rate fell below 0.032 BTC, the key support level associated with previous continuation attempts was removed.
The ETH/BTC ratio also fell below the 21-day moving average, indicating that its relative strength against Bitcoin is waning. The next highest time frame level is near 0.026 BTC, where buyers previously intervened.
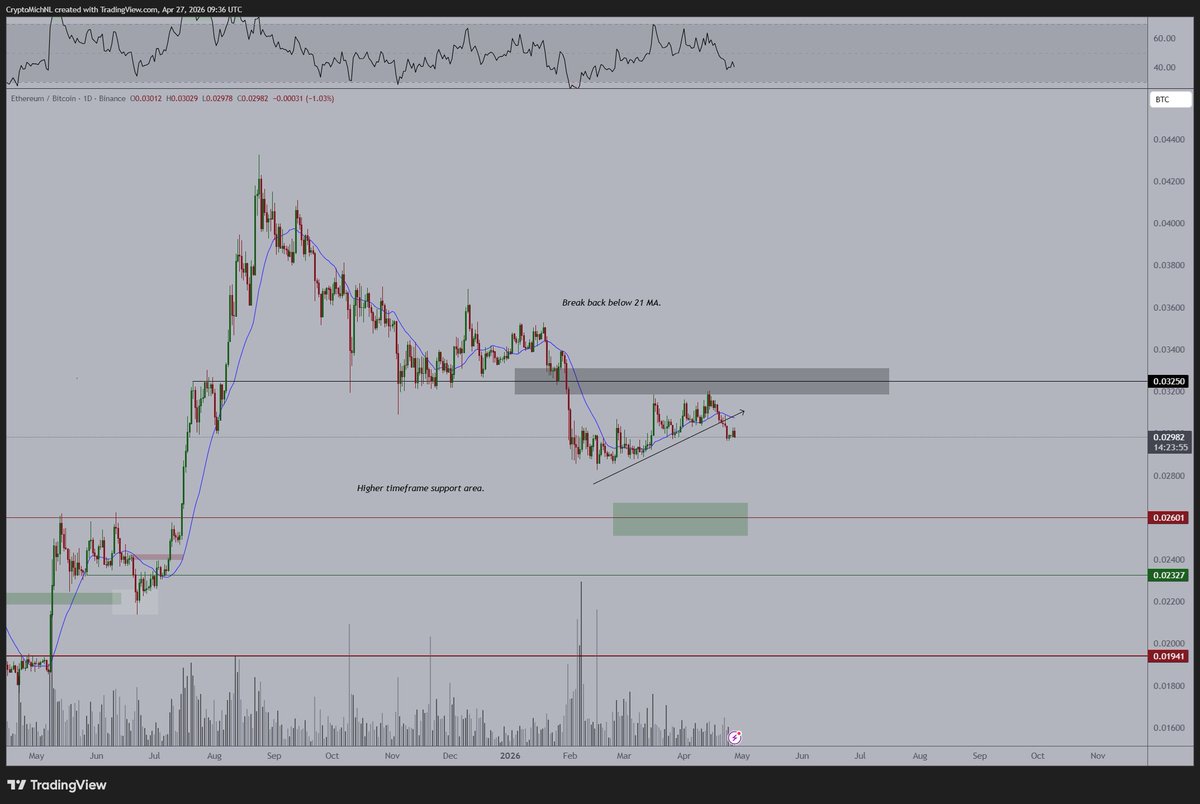
Binance ETH/BTC chart analysis. Source: CryptoQuant
Related: BitMine acquires 101,000 ETH despite unrealized losses of $6.5 billion.
ETH Futures Positions Hint Market Reset
Ether’s open interest (OI) on Binance has fallen to $2.58 billion, consistent with levels earlier this month when ETH was trading near $2,200. This decline signals a leverage reset following recent positioning.
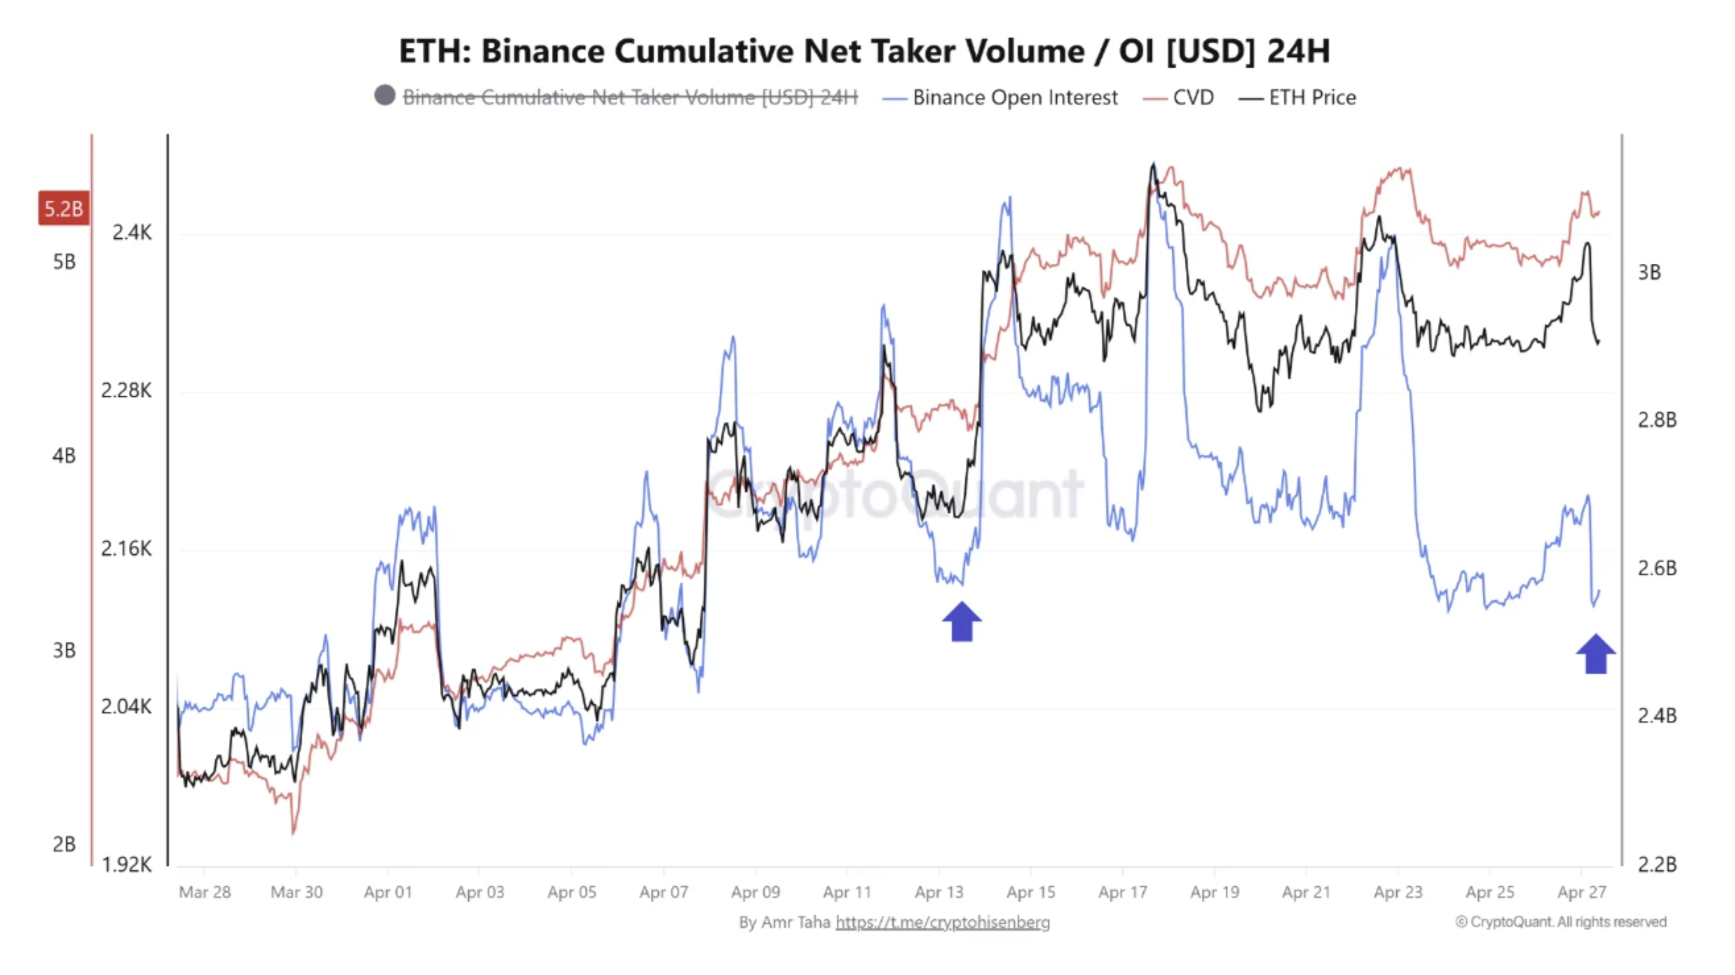
ETH: Binance cumulative net taker volume. Source: CryptoQuant
The funding rate is close to -0.013%, the lowest since February, providing a clearer signal. Short positions dominate new activity, while previous long exposures have declined.
Crypto analyst Amr Taha pointed out that this combination puts ETH in an environment with low leverage and high short selling. If the price remains close to the current level, the imbalance between positioning and price will deepen, which could lead to a breakout sooner rather than later.
The key area centers around $2,150, where liquidation risk and current technical levels converge on the daily chart.
Related: ETH Price Up 10% in April, Why Is the Ethereum Foundation Selling?