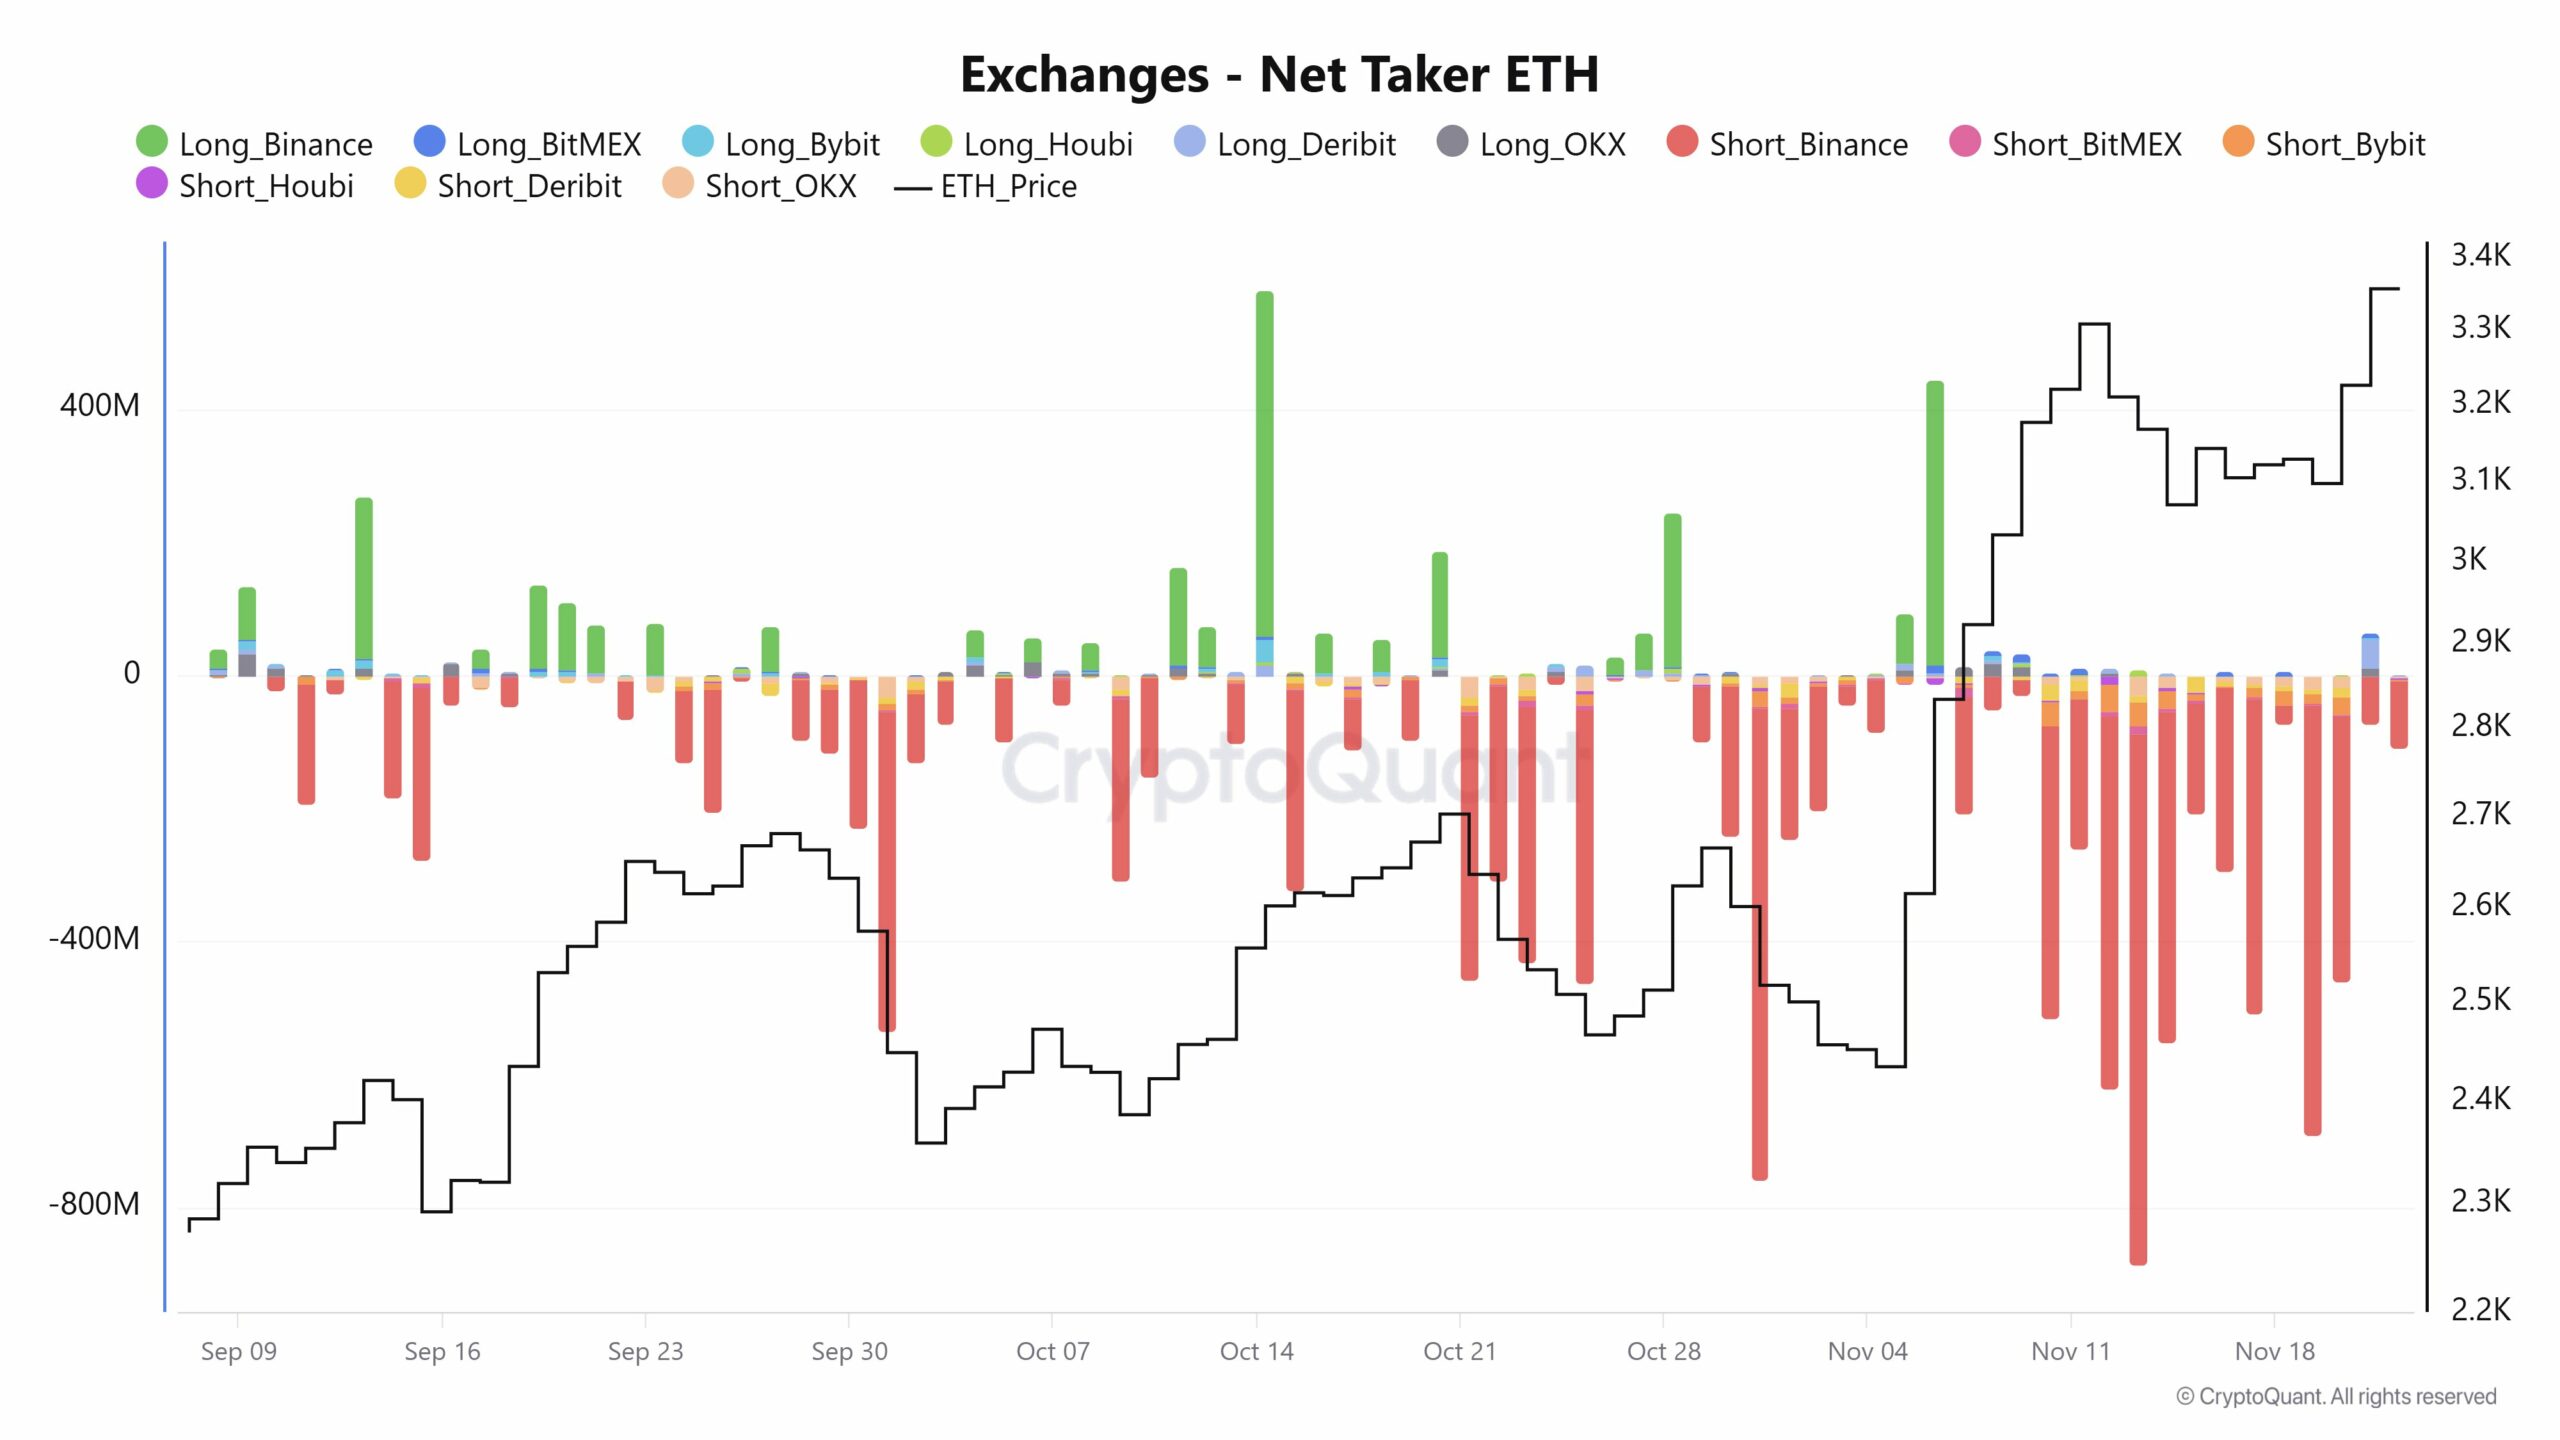
- There is a big difference in the net taker size when exchanging Bitcoin and Ethereum.
- Three factors could influence ETH to change to the right.
Exchange activity between Bitcoin (BTC) and Ethereum (ETH) has been shown to have a significant impact on market behavior.
For beginners, CryptoQuant’s Taker Buy/Sell Ratio provides insight into market sentiment by showing the ratio of buy orders to sell orders, an important indicator during a market rally or correction.
At press time, both Bitcoin and Ethereum showed distinct patterns in the size of exchange net takers.

Source: CryptoQuant
Ethereum’s net takers have shown that the asset does not behave similarly to BTC. This plays a pivotal role in shaping the short-term and long-term outlook for these cryptocurrencies.
As the mostly negative currency reading turns positive, ETH could see a big pump as more traders take long positions. But when and how does this happen?
ETH derivatives signal bullish momentum
One of the influencing factors is the bullish momentum in the Ethereum derivatives market. Open Interest has surpassed the previous ATH, exceeding $13 billion.
This 40% increase over the past four months is indicative of participation in the Ethereum derivatives sector.
The moderately positive funding ratio further confirmed the dominance of long-term position traders, further confirming the near-term strength.


Source: CryptoQuant
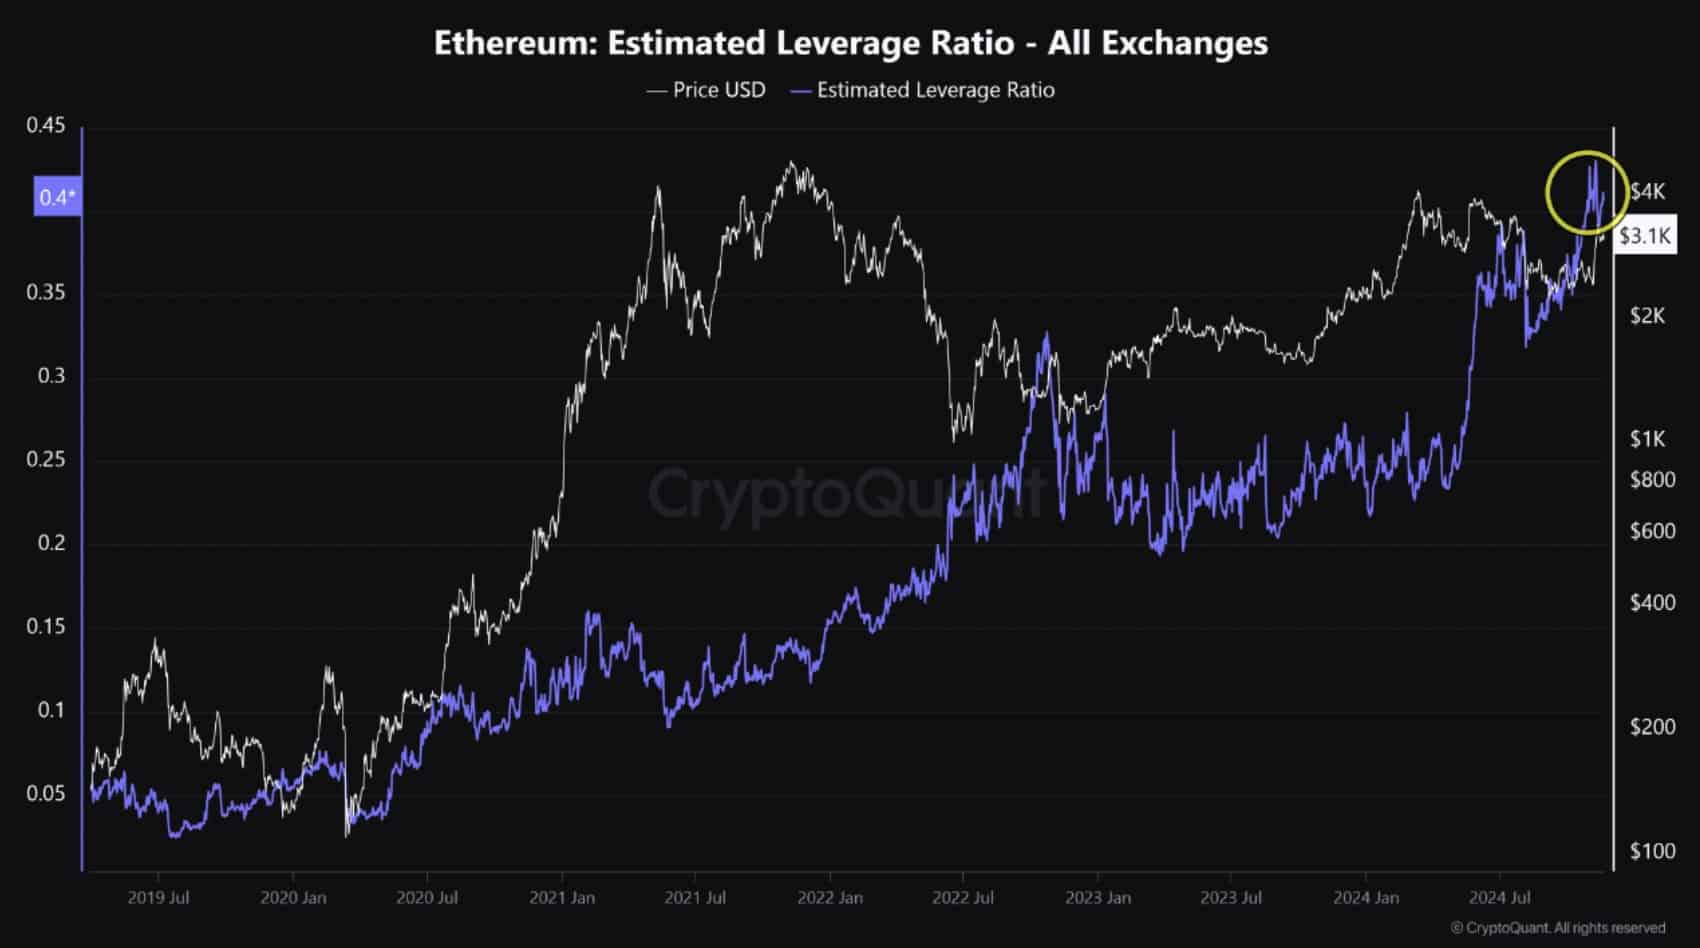
Moreover, Ethereum’s estimated leverage ratio reached +0.40 for the first time, hitting a new high.
This indicator of increasing leveraged positions reflects a greater propensity to take risk among investors.
Despite the optimism, high leverage and the dominance of long positions may increase the likelihood of a buying squeeze.
These market corrections can occur when sudden price movements cause traders to liquidate positions quickly, reminding them of the inherent risks associated with highly leveraged trading.
High leverage liquidation and altcoin season
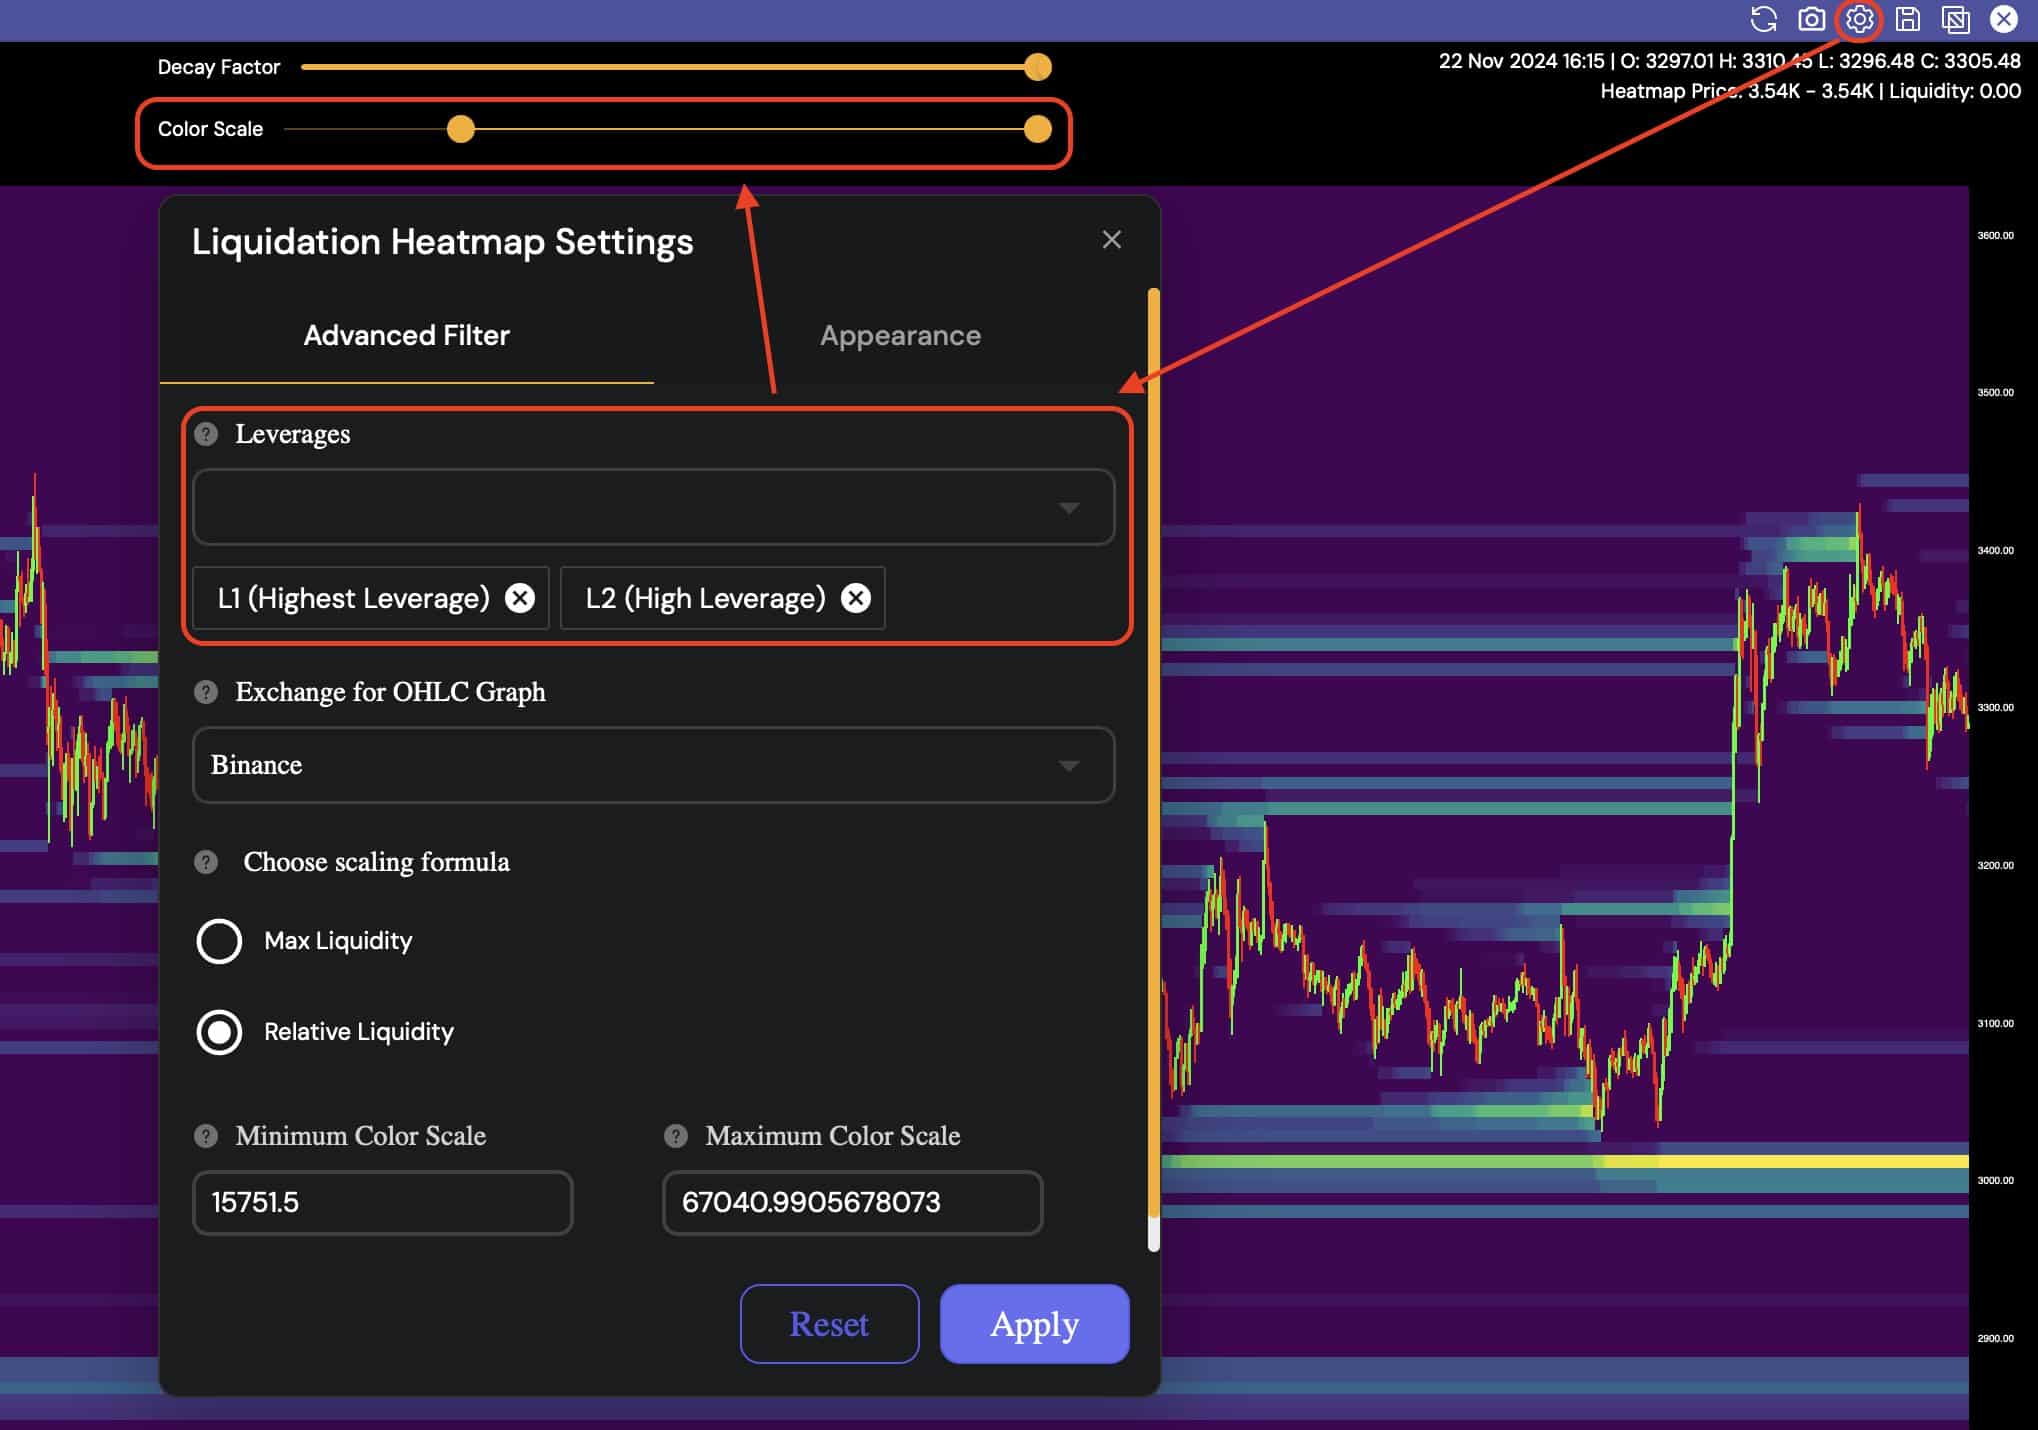
Again, the heatmap continues to show highly leveraged liquidations against the ETH price.
If the adjustment is set to focus only on the high portions (L1 and L2), leverage has shown a significant area where large liquidations can cause significant price movements.
These adjustments helped highlight key liquidation clusters and reveal risk areas just above current prices.


Source: Hiblock Capital
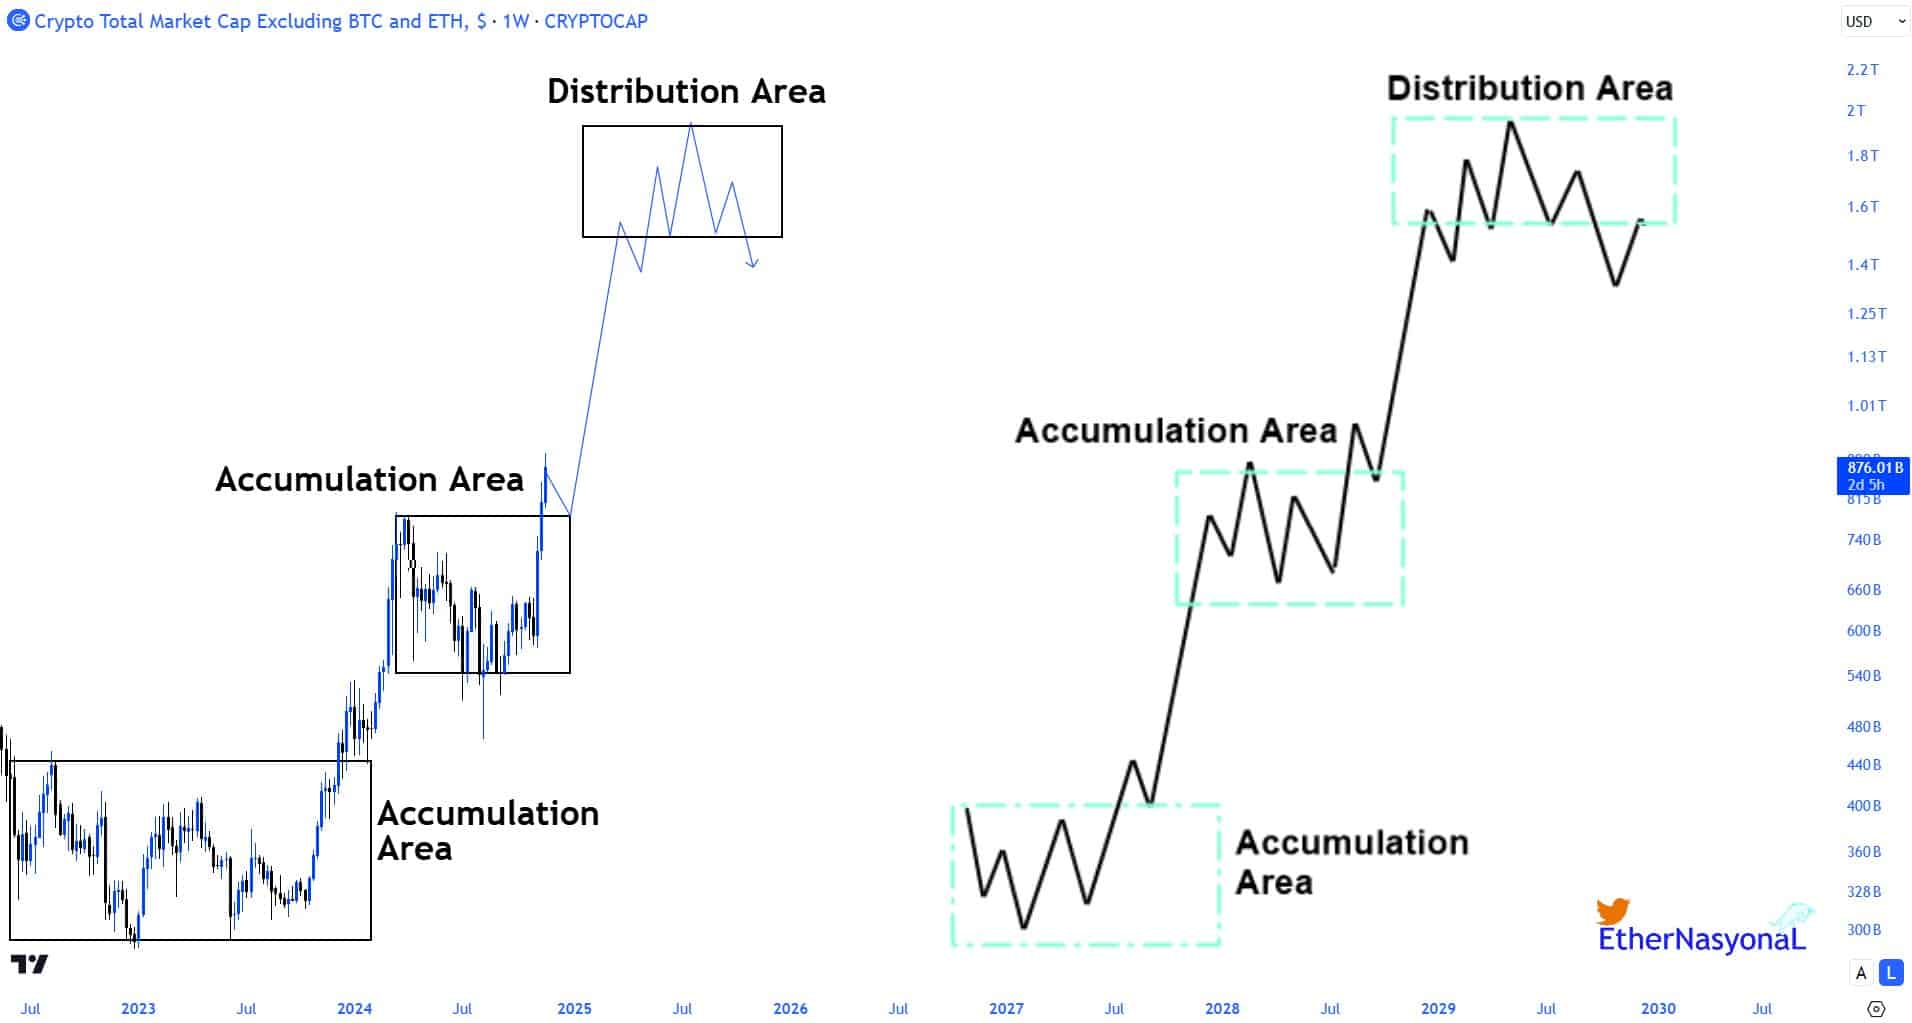
Finally, tThe altcoin market represented by the TOTAL3 index began its second parabolic phase in October 2023.
This move marks a shift away from the second accumulation zone of the Wyckoff method and has set the altcoin on a strong upward trend.
The recent price action led the altcoin to retest and safely move above the channel high and eventually surpass the May 2024 high.


Source: TradingView
Current capital inflows have targeted large-cap stocks and select mid-cap altcoins, fueling this rally.
Read Ethereum (ETH) price prediction for 2024-2025
Despite being a key player, Ethereum has seen a slower but more consistent rise, putting it on solid footing as opposed to Bitcoin’s faster rise.
This systematic rise could potentially lead to a change in behavior from the altcoin kings.

