Crypto Flexs
  • DIRECTORY
  • CRYPTO
    • ETHEREUM
    • BITCOIN
    • ALTCOIN
  • BLOCKCHAIN
  • EXCHANGE
  • TRADING
  • SUBMIT
Crypto Flexs
  • DIRECTORY
  • CRYPTO
    • ETHEREUM
    • BITCOIN
    • ALTCOIN
  • BLOCKCHAIN
  • EXCHANGE
  • TRADING
  • SUBMIT
Crypto Flexs
Home»ETHEREUM NEWS»Ethereum Crash May Be Over: This Key Pattern Foreshadows a Rally to $4,000
ETHEREUM NEWS

Ethereum Crash May Be Over: This Key Pattern Foreshadows a Rally to $4,000

By Crypto FlexsSeptember 5, 20243 Mins Read
Facebook Twitter Pinterest LinkedIn Tumblr Email
Ethereum Crash May Be Over: This Key Pattern Foreshadows a Rally to ,000
Share
Facebook Twitter LinkedIn Pinterest Email

Like Bitcoin, Ethereum has faced significant challenges in recent months, and has struggled to sustain a major price rally. After reaching a high above $4,000 in March, Ethereum has continued to decline and has not been able to break out of this bearish trend.

The second-largest cryptocurrency by market cap has lost more than 5.9% of its value over the past two weeks and is currently hovering around $2,400. Ethereum, which is currently trading at $2,434, is down 2.4% over the past week and 0.4% over the past 24 hours.

Will there ever be a rebound to $4,000?

Despite this slowdown, market analysts are optimistic about a potential reversal. According to a recent post by ‘The Moon’ on X, Ethereum could be ready to rally back to $4,000 if certain technical conditions are met.

In particular, The Moon highlighted Ethereum’s current 1D Falling Wedge formation, a common chart pattern in technical analysis that often signals a potential reversal. “Once the breakout occurs, there is a good chance that Ethereum will rally back to $4,000,” the analyst said.

To put that in context, in technical analysis, a falling wedge is a pattern where the price of an asset is in a downtrend, but the range is narrowing.

This pattern generally suggests that the downside momentum is weakening, and a reversal could occur if the price breaks above the wedge. This is what The Moon is predicting for Ethereum. A potential breakout could lead to a surge to the previous high.

Ethereum (ETH) price chart on TradingView

Ethereum Experiences Rising Bullish Sentiment

Meanwhile, other analysts in the cryptocurrency community shared similarly bullish sentiments about Ethereum’s future performance. Renowned cryptocurrency analyst Crypto Jack noted that Ethereum’s price is approaching key long-term support levels.

Jack said a bounce from $2,200 could be a strong reversal signal, potentially leading to a bullish trend. This long-term support level could be crucial as Ethereum tries to regain momentum after weeks of underperformance.

price $Ethereum Long-term support is approaching.

Rebound from $2.2k #Ethereum It can be very strong. pic.twitter.com/pepeDZm5FA

— CryptoJack (@cryptojack) September 4, 2024

Adding strength to the bullish outlook, crypto analyst Max recently noted on X that Ethereum is currently trading within a massive triangle pattern.

According to Max, this formation, combined with the possibility of a double bottom forming near the upward sloping trendline, could be a signal that Ethereum is ready for a significant uptrend.

Ethereum chart.

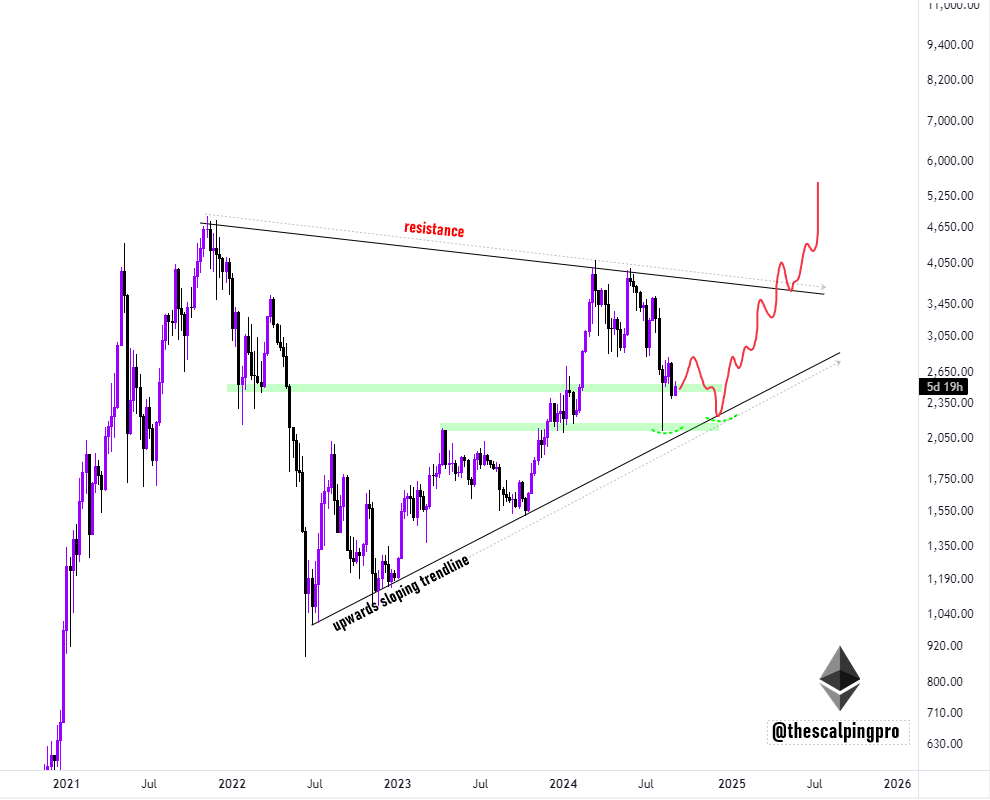
A double bottom occurs when an asset forms two lows at approximately the same price level, indicating strong support and a potential bullish reversal.

Featured image made with DALL-E, charts from TradingView

Share. Facebook Twitter Pinterest LinkedIn Tumblr Email

Related Posts

Fusaka Update – Information for Blob Users

October 18, 2025

Class action lawsuit claims Microsoft choked AI supply to drive up ChatGPT costs

October 14, 2025

‘OG’ Whale Attracts Over $400 Million in Bearish BTC Bet

October 10, 2025
Add A Comment

Comments are closed.

Recent Posts

5 Best Crypto Flash Crash And Buy The Dip Crypto Bots (2025)

October 18, 2025

Billionaire Tim Draper Leads $3.2M Seed Round For Ryder To Replace Seed Phrases With TapSafe Recovery

October 18, 2025

IRANcoin Global Reserve (IRCOIN) launches to reshape global digital payments

October 18, 2025

Fusaka Update – Information for Blob Users

October 18, 2025

6 Best AI Quant Bots To Use In 2025: Smarter Trading Starts Here

October 18, 2025

BTC RSI hits April low as Coinbase premium turns red.

October 18, 2025

The Great Inheritance and Crypto: What you need to know.

October 17, 2025

6 Best AI Quant Bots To Use In 2025: Smarter Trading Starts Here

October 17, 2025

AI and Bitcoin mining stocks soar after OpenAI closes multibillion-dollar chip deal with AMD

October 17, 2025

MEXC Celebrates ZEROBASE (ZBT) Listing With Airdrop+ Event Featuring 55,000 USDT Prize Pool

October 16, 2025

How MasterQuant’s AI Trading Bot Is Becoming Every Investor’s Favorite Trade Machine

October 16, 2025

Crypto Flexs is a Professional Cryptocurrency News Platform. Here we will provide you only interesting content, which you will like very much. We’re dedicated to providing you the best of Cryptocurrency. We hope you enjoy our Cryptocurrency News as much as we enjoy offering them to you.

Contact Us : Partner(@)Cryptoflexs.com

Top Insights

5 Best Crypto Flash Crash And Buy The Dip Crypto Bots (2025)

October 18, 2025

Billionaire Tim Draper Leads $3.2M Seed Round For Ryder To Replace Seed Phrases With TapSafe Recovery

October 18, 2025

IRANcoin Global Reserve (IRCOIN) launches to reshape global digital payments

October 18, 2025
Most Popular

Bitcoin Core Development – PinSketch Why are sketches made up of sums of odd powers?

February 8, 2024

BTC price hits 19-month high amid ‘choreographed’ Bitcoin whale move

December 5, 2023

WLD is up 23% as Worldcoin bulls emerge. But why now?

July 18, 2024
  • Home
  • About Us
  • Contact Us
  • Disclaimer
  • Privacy Policy
  • Terms and Conditions
© 2025 Crypto Flexs

Type above and press Enter to search. Press Esc to cancel.