- Ethereum registered the highest dApp volume in the last 30 days.
- ETH’s price trend has been less active.
Ethereum’s (ETH) decentralized application (dApp) ecosystem has seen an impressive surge in activity, with trading volume increasing 38% over the past month.
This growth signals renewed interest in the DeFi, NFT, and gaming sectors. But important questions still remain. Will this on-chain activity lead to an upward trend in the price of ETH?
The Ethereum network appears to be active with increased gas usage, increased transaction volume, and dApp participation. Nonetheless, price action remains cautiously optimistic.
Ethereum dApp volume increases
Recent data from DappRadar shows that Ethereum dApp usage is steadily increasing.
As of November 19, 2024, total trading volume has reached $3.54 billion, and the number of daily unique active wallets (UAW) has surged to 78.53 million, indicating growing ecosystem participation.

Source: DappRadar
The analysis also shows that in the past 30 days, dApp volume has grown to nearly $150 billion, a record high.
The data also shows an increase of 37.67% over the past 30 days, with the increase being the most influential.
DeFi protocols were the biggest contributors to this growth, benefiting from higher total value locked (TVL) as lending and trading activity gained momentum.
NFT marketplaces and blockchain-based gaming platforms have also played a significant role in facilitating transactions.
On-chain activity reflects increased demand.
AMBCrypto’s analysis of Ethereum’s on-chain activity provided additional context to the growing dApp ecosystem.
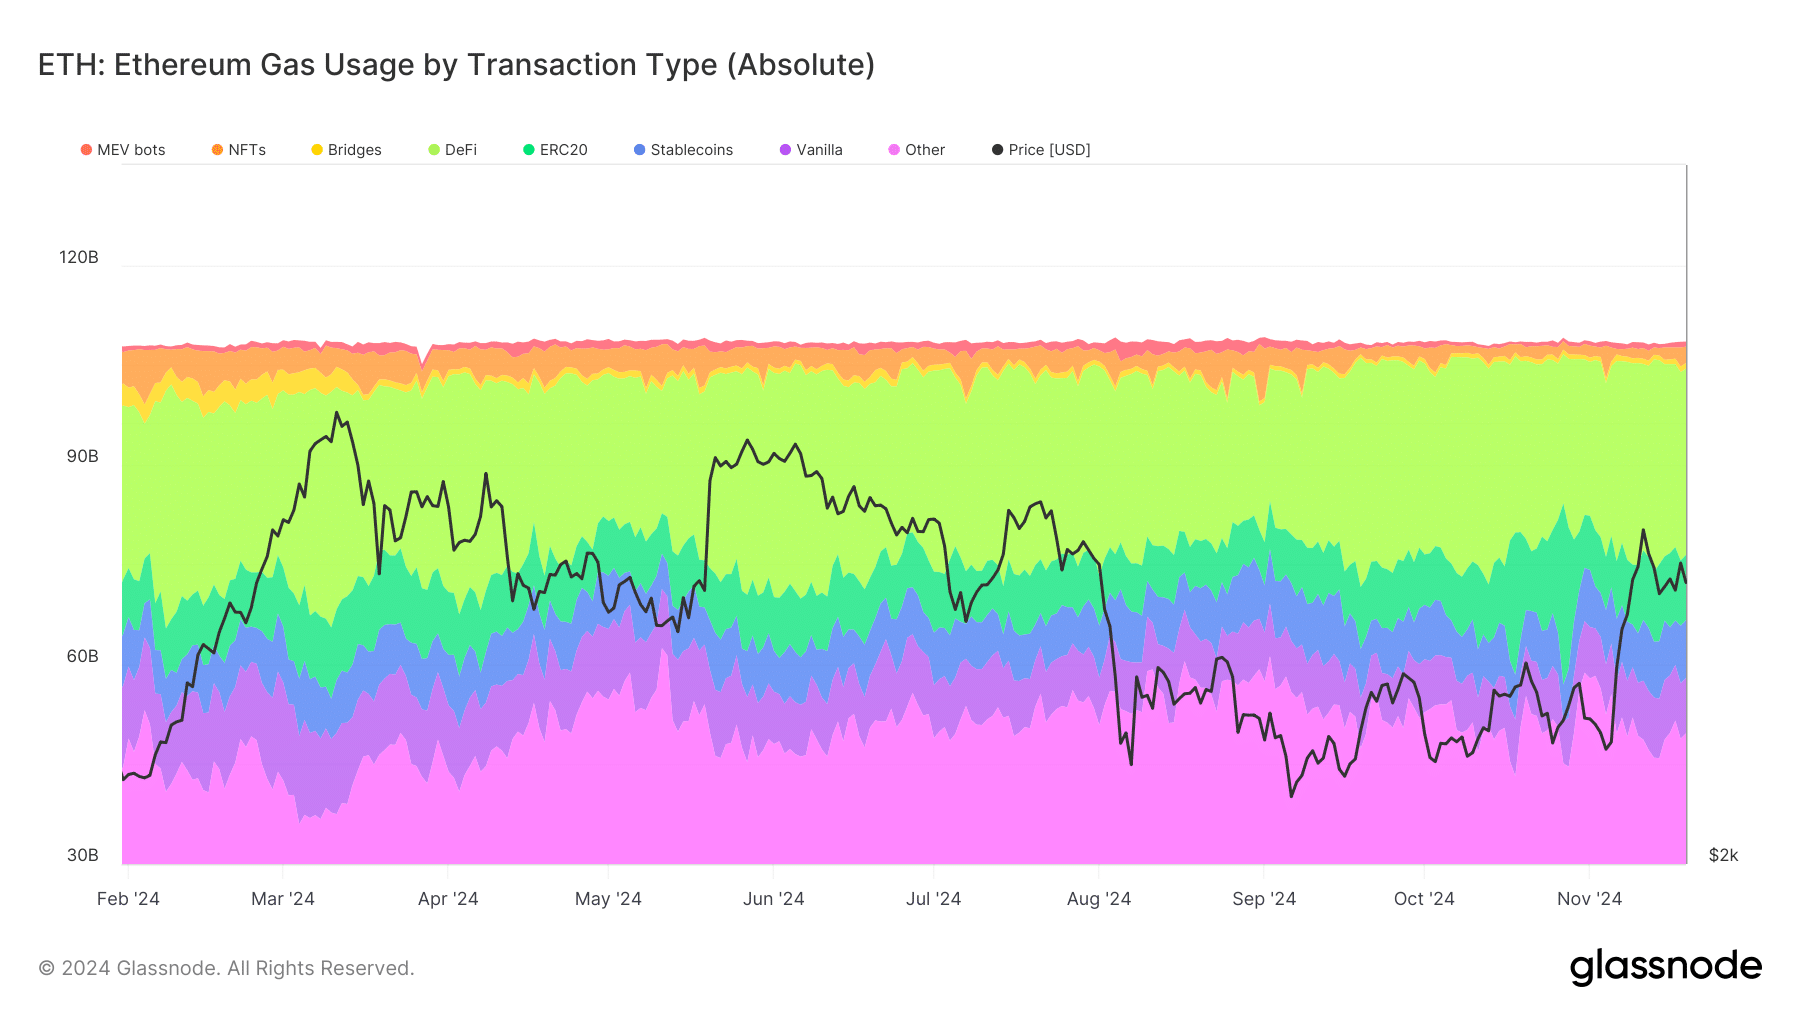
According to Glassnode, gas usage has increased across a variety of transaction types, including DeFi, NFT, and stablecoin transfers. Further analysis shows that the DeFi sector dominates the platform’s gas usage.


Source: Glassnode
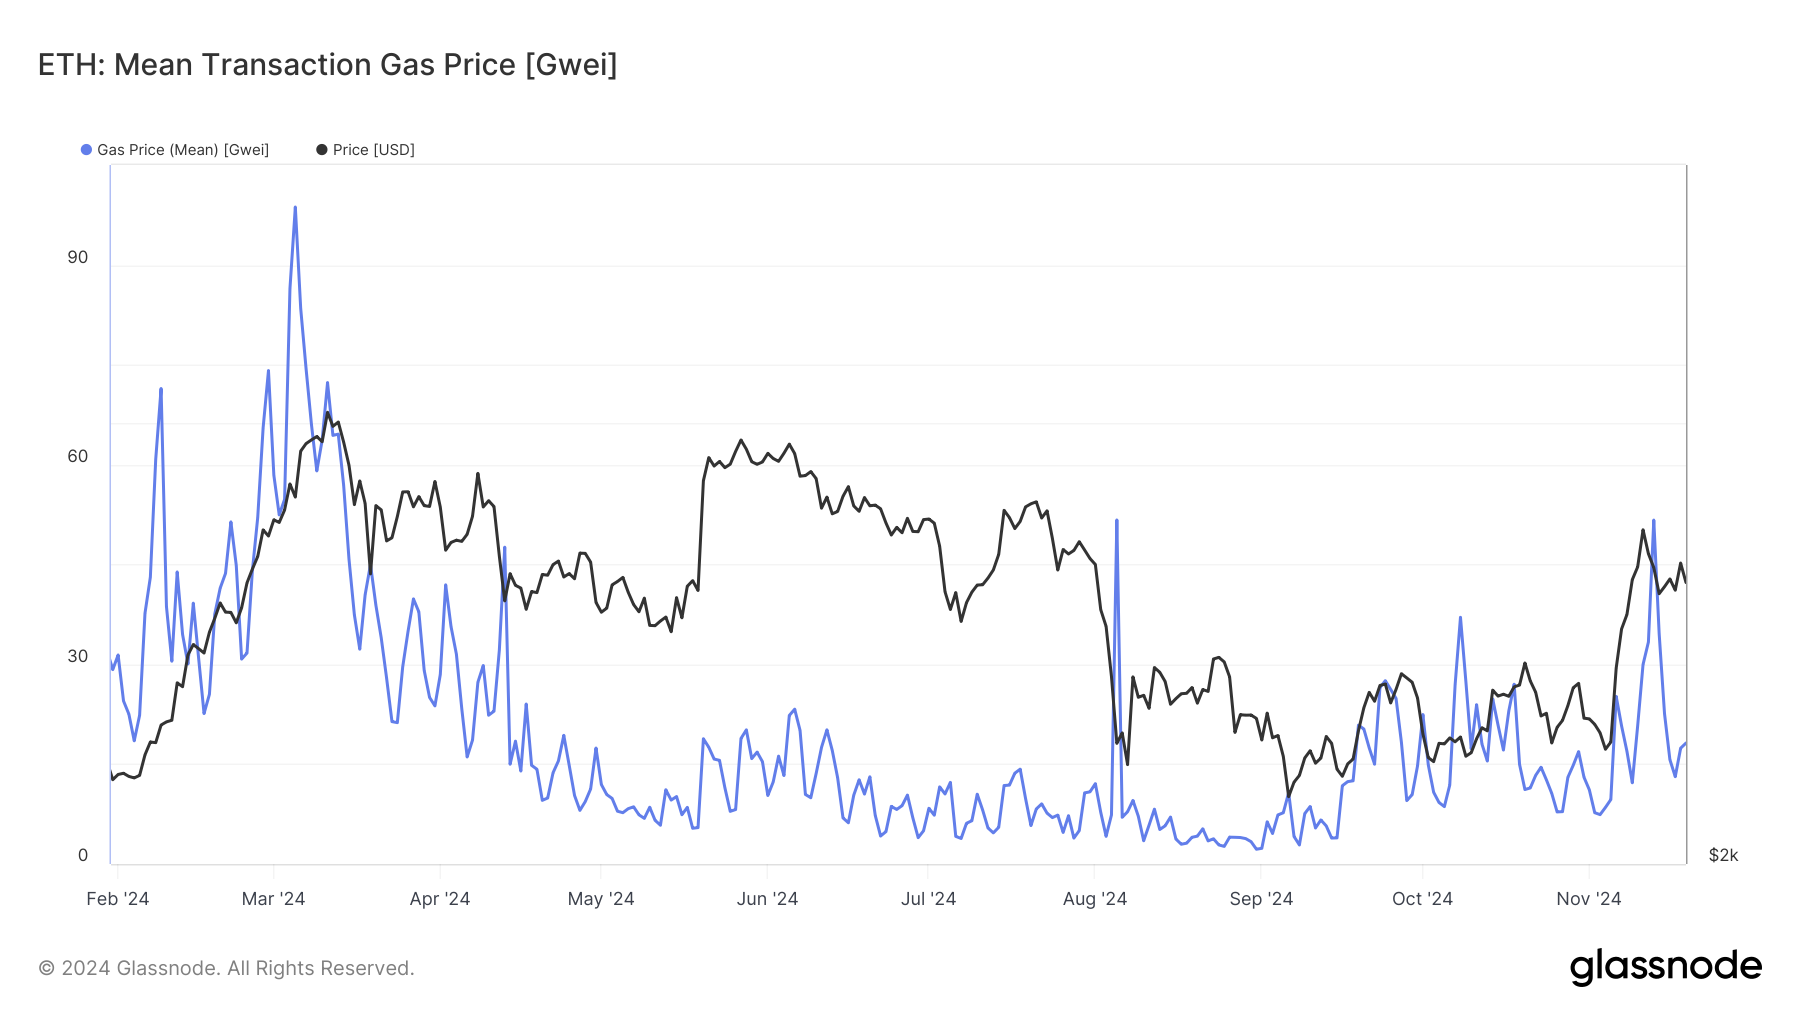
The analysis also found that gas prices have recently surged to an average of 50 Gwei. Historically, high gas fees have coincided with surges in on-chain activity, which often precede significant price movements in ETH.


Source: Glassnode
Ethereum price movement and technical indicators
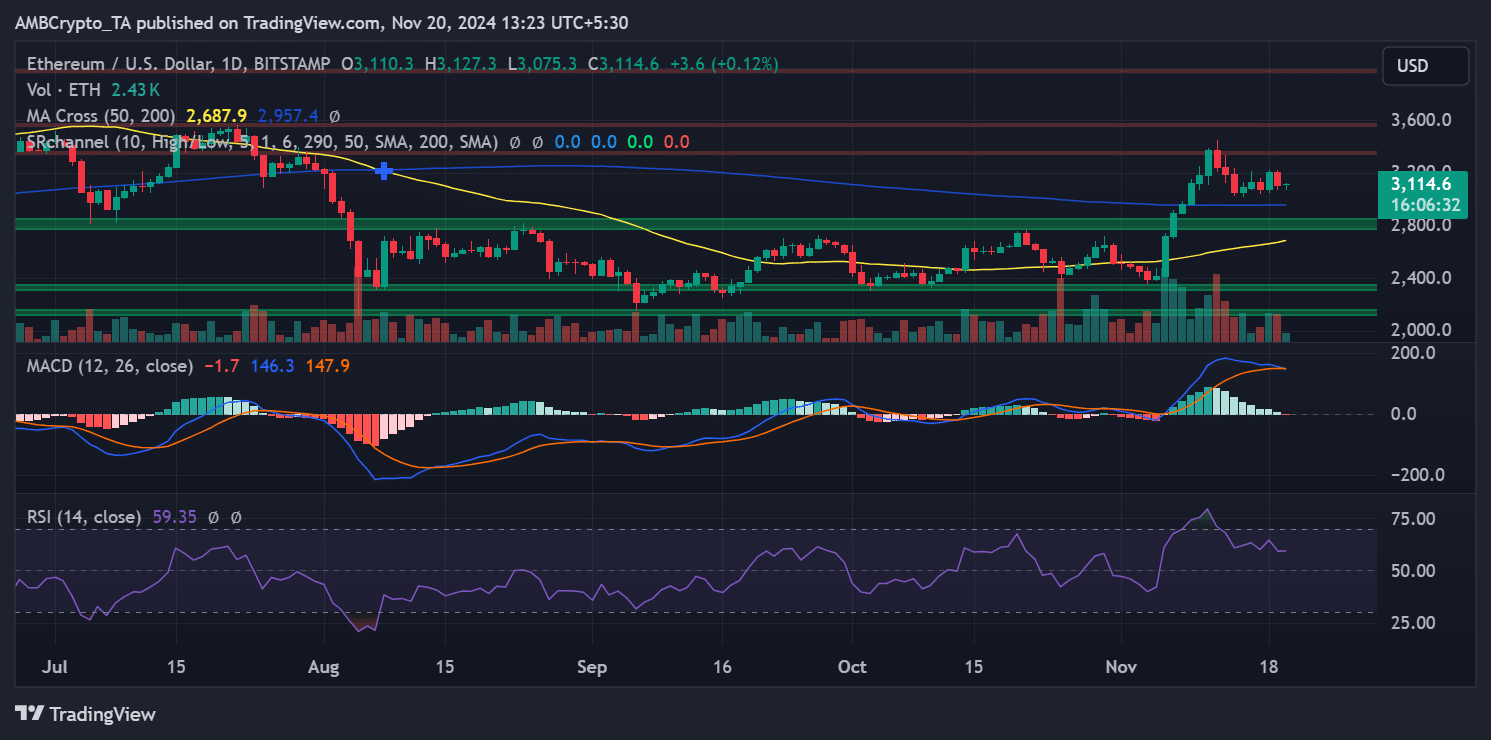
Despite the increase in network activity, Ethereum’s price action remains calm, with it trading around $3,114 at press time. The technical outlook also revealed mixed signals.
Notably, the 50-day moving average of $2,687 is higher than the 200-day moving average of $2,957, indicating an overall bullish trend. MACD shows a slight bearish divergence, indicating weakening momentum.
Meanwhile, the RSI of 59.35 reflects neutral conditions, suggesting that Ethereum price could move in either direction in the near term.


Source: TradingView
Ethereum needs to break the critical resistance of $3,200 to maintain its bullish trajectory.
The downside is that the $3,000 support level is critical, as a breach could result in a lengthy integration phase or even a short-term fix.
Will ETH follow dApp volume surge?
The significant increase in dApp volume on Ethereum highlighted strong network demand. However, translating these activities into sustained price increases depends on a number of factors.
The continued expansion of the DeFi and NFT sectors could improve Ethereum’s intrinsic value, attracting investor attention.
Additionally, ecosystem upgrades such as EIP-4844 (Proto-Danksharding) are expected to improve scalability and network efficiency, potentially increasing the attractiveness of Ethereum.
Read Ethereum (ETH) price prediction for 2024-25
But challenges still remain. High gas fees may limit the growth of the ecosystem by discouraging further participation from users.
Broader macroeconomic conditions and fluctuations in the price of Bitcoin may also strain Ethereum’s ability to capitalize on network activity.

