- HYPE was trading within a bullish flag pattern, signaling a possible breakout towards $50.
- Key indicators, including a rise in Total Value Locked (TVL), suggested that the market rally was gaining momentum.
Over the past 24 hours, Hyperliquid (HYPE) has recorded a significant price movement of 14.67%, reclaiming the $26 range last seen in early January. This followed a brief monthly decline of 6.09%.
The current market trend and strong bullish correction indicate further upward momentum and we expect HYPE to continue its uptrend in the coming weeks.
HYPE’s final countdown
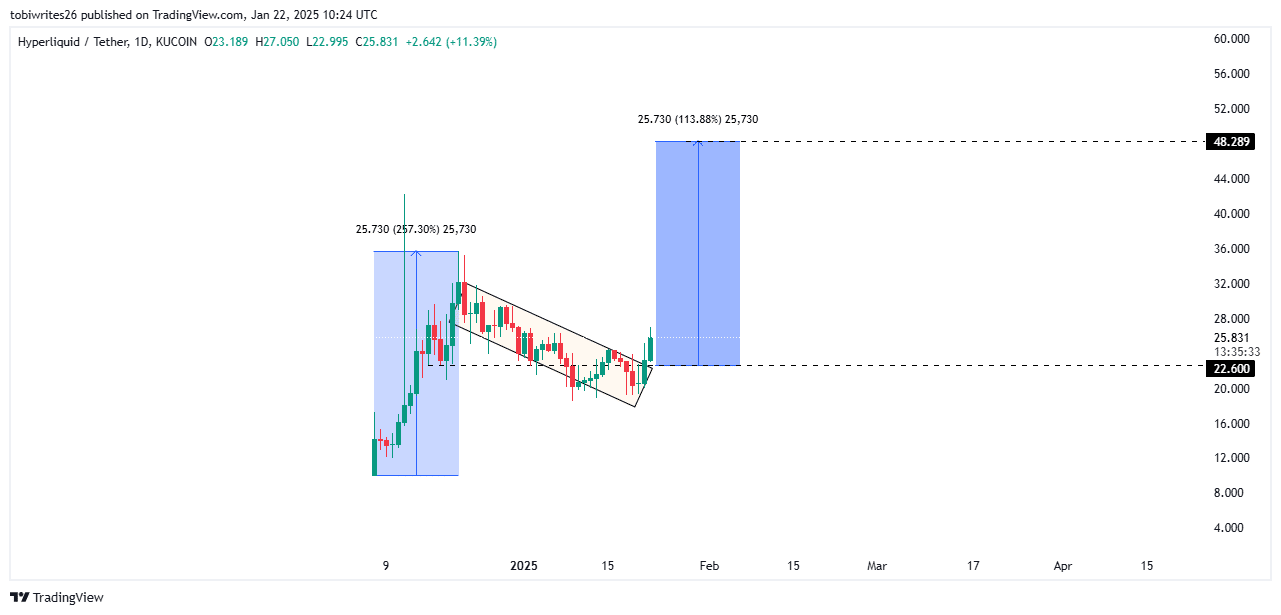
The final stage of HYPE’s bullish flag pattern – rally, consolidation and eventual price surge – is starting to unfold. This classic technical configuration positions assets for a potential breakout.
HYPE has soared 257.03% since its launch and has since gone through a consolidation phase within well-defined support and resistance levels. Recently, HYPE broke out of this range and entered the final leg of the pattern.

Source: TradingView
If this pattern holds, HYPE could mirror the initial rally and rise another 113.8% to a new all-time high at around $48.3.
Early signs of this upward movement have already emerged as HYPE broke through the consolidation level, indicating bullish momentum.
However, if HYPE fails to form higher highs and higher lows, it may return to a consolidation phase.
AMBCrypto’s analysis highlights strong market sentiment and positive indicators, which suggest that HYPE is more likely to maintain its upward trajectory and continue hitting higher highs.
Momentum changes as key indicators turn bullish.
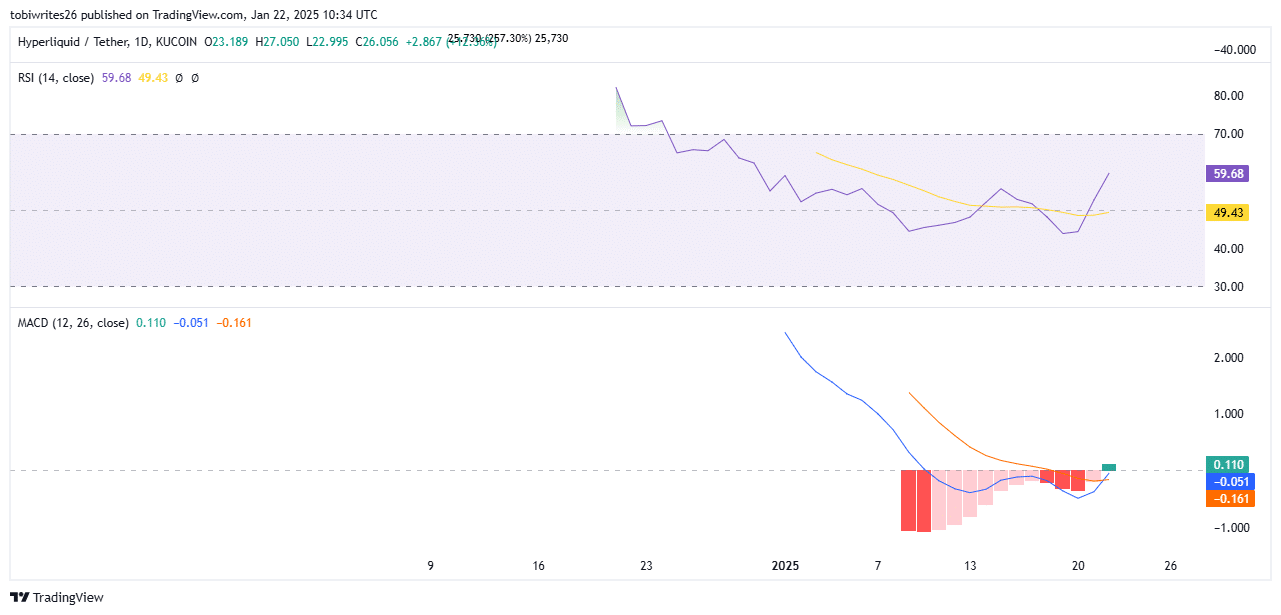
Key technical indicators including Relative Strength Index (RSI) and Moving Average Convergence Divergence (MACD) are now showing a bullish trend for HYPE.
RSI, which measures the speed and scale of price changes, is back in positive territory above 50 for the first time since January 13.
When the RSI stays above this level, it usually indicates increased buying pressure and the potential for continued price rises.


Source: TradingView
Meanwhile, MACD has formed a golden cross, a bullish pattern that appears when the blue MACD line crosses over the orange signal line.
As can be seen in the chart, these developments suggest strengthening upward momentum.
If both lines cross into positive territory (-0.051 and -0.161 at press time), the bullish wave supported by the rising green histogram may accelerate.
On-chain indicators provided further confirmation of the improving sentiment.
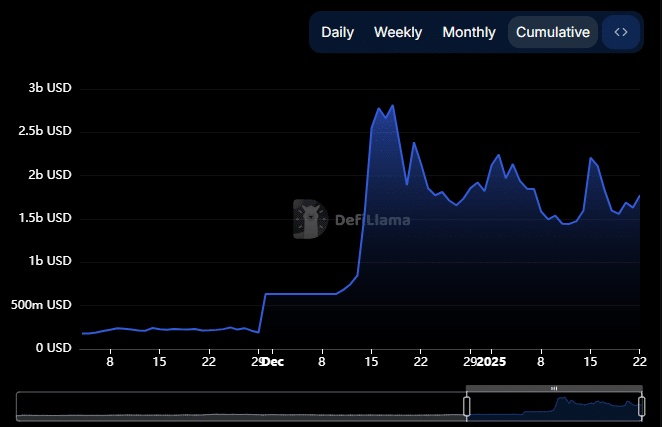
Total Value Locked (TVL), a key indicator of blockchain health and liquidity inflows, rose to $1.795 billion from a low of $1.559 billion on January 19.


Source: DeFiLlama
Read Hyperliquid (HYPE) price forecast for 2025-2026
This gradual increase in TVL reflected increased investor confidence and hinted at potential further gains for HYPE.
If this trend continues, HYPE could see continued upward momentum as market sentiment continues to improve.

