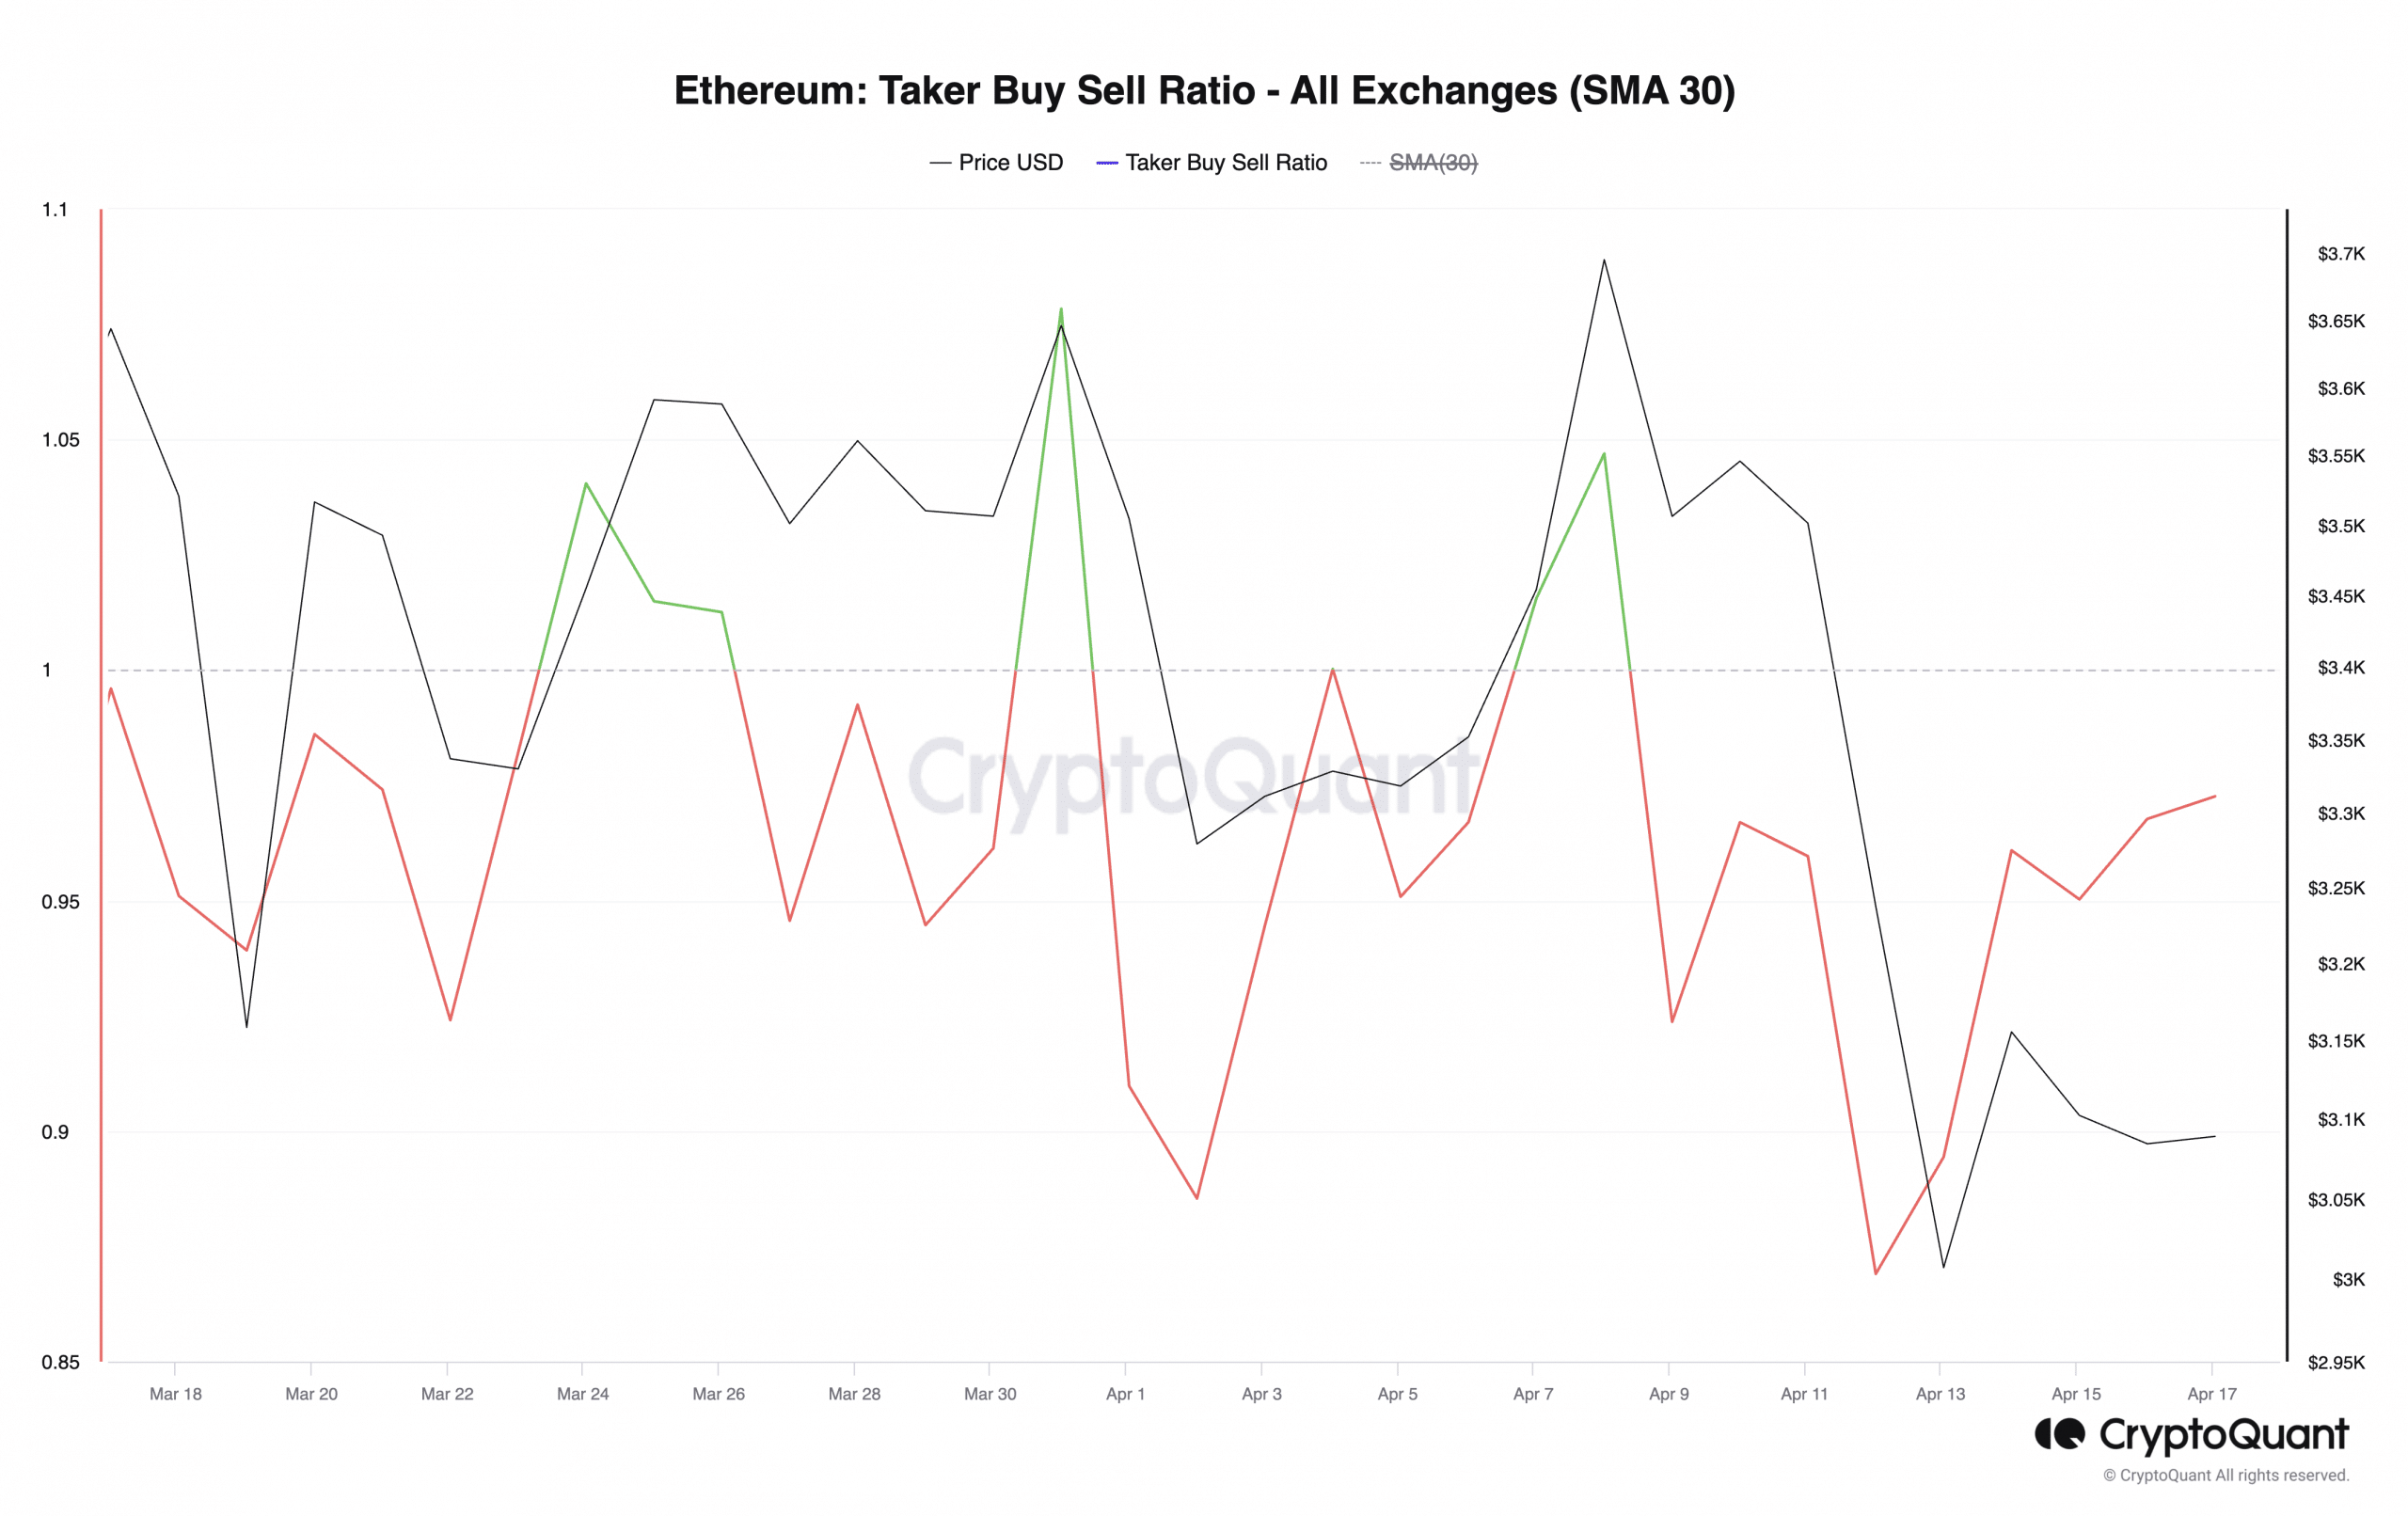
- Ethereum’s Taker Buy Sell Ratio is attempting to breach the center line in an uptrend.
- However, bearish sentiment continues to grow.
Ethereum (ETH) The Taker Buy Sell Ratio is poised to cross the center line, indicating an increase in bullish sentiment due to recent market issues. CryptoQuant showed it
Taker Buy Sell Ratio is an indicator that measures the ratio between buy and sell volumes in the asset futures market.
A value greater than 1 means that the buying volume is greater than the selling volume, and a value less than 1 means that the selling volume is greater than the buying volume.
At press time, CryptoQuant data showed ETH’s Taker Buy Sell Ratio was 0.96.

Source: CryptoQuant
Bear maintains control
Despite the surge in ETH’s taker buy-sell ratio, bearish sentiment remains significant, according to assessments on the coin’s spot and futures markets.
For example, ETH futures open interest fell to its lowest since February 28th. coin glass data. It has been on a downward trend since peaking at $15 billion on April 9.
As of this writing, ETH’s open interest stands at $11 billion, a plunge of 27% over the past seven days.
Open interest in an asset measures the value of futures contracts that have not yet expired.
A decline in this way means that market participants are closing positions and exiting the market rather than opening new positions.
Over the past week, ETH’s funding rate briefly turned negative on April 14th, when a significant number of market participants began trading against the price of the coin.
This is the first time ETH has recorded a negative funding ratio since the bull market rally began in October 2023.


Source: Coinglass
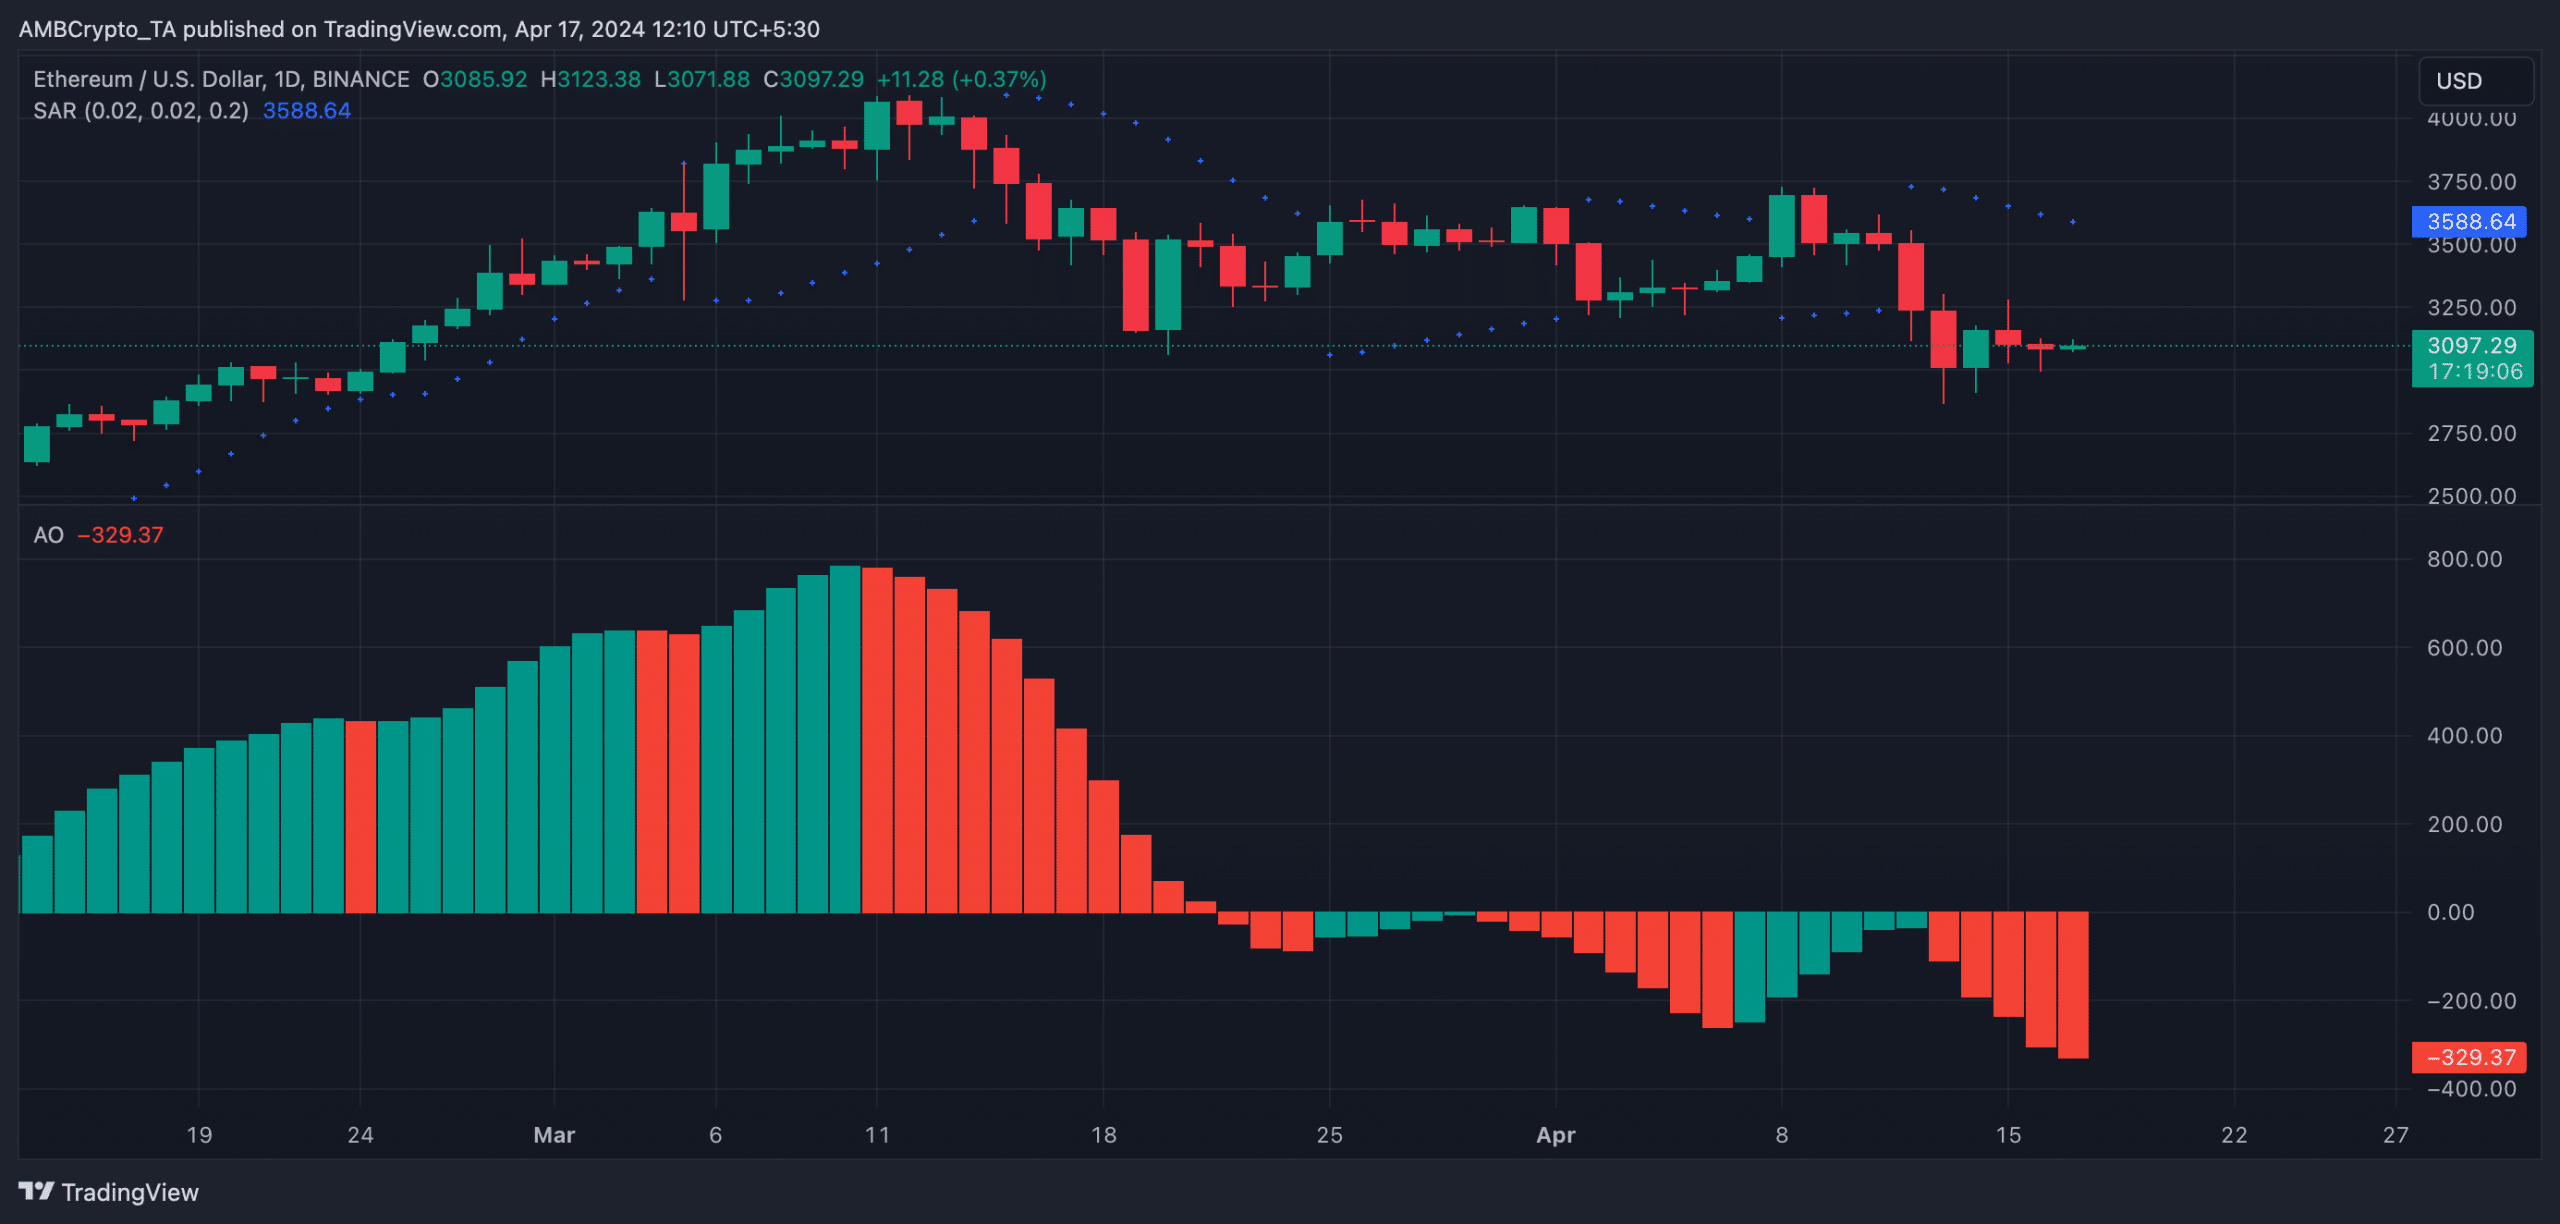
Key technical indicators observed on the daily charts of the spot market hinted at a possible decline below $3000 if the bearish sentiment persists.
ETH’s Awesome Oscillator, which measures market momentum, posted a downward red histogram bar at press time. This trend has been visible since April 13th.
A downward red bar on an asset’s Awesome Oscillator is often interpreted as a bearish signal, indicating increasing selling pressure.
Likewise, ETH’s Parabolic Stop and Reverse (SAR) reading showed a point forming an indicator above the price of the coin.
Read Ethereum (ETH) price prediction for 2024-25
The Parabolic SAR indicator is used to identify potential trend directions and reversals.


Source: ETH/USDTradingView
When the dotted line is above the asset price, the market trend is considered bearish.

