Bitcoin is close to its all-time high of $69,000 in November 2021. Several traders had predicted a new high later this year, but it came earlier than expected. Traders are excited about the launch and robust demand for spot exchange-traded funds. According to post From the Zero Hedge financial blog. By comparison, SPDR Gold Shares (GLD), the first US gold ETF, took more than two years to reach $10 billion in AUM.
Institutional investors continued to pour money into digital asset investment products, hitting $1.84 billion last week, the second-largest weekly inflow, according to CoinShares’ Digital Asset Fund Flows Weekly Report. The latest inflows bring total AUM to $82.6 billion, just shy of the $86 billion AUM peak set in early November 2021. However, some investors appear to be bearish in the near term or hedging their assets. Short Bitcoin investment products attracted $22 million.
It’s not just Bitcoin that’s actually seeing action. Memecoin has gained momentum over the past few days and has soared higher. Dogecoin, the original memecoin, is up more than 100% in the past seven days. Other memecoins such as Pepe, BONK, and SHIB have also seen rapid gains over the past few days. memecoin’s strong rally shows that a bubble is building and could lead to a short-term correction.
Another reason to be cautious in the near term is that Bitcoin’s open interest surged to $31 billion on March 4, well above the record of $24.3 billion set on April 14, 2021. Bitcoin’s long-term story remains the same, but volatility is likely to increase in the short term.
Can Bitcoin hit and maintain new highs above $69,000 in the coming days? Will altcoins continue their upward trend? Let’s study the chart to find out.
BTC/USD market analysis
We said in our previous analysis that Bitcoin could reach $60,000, but the price easily surpassed that level. This indicates aggressive buying by the bulls at all high levels.
Momentum strengthened after the price rebounded from the 20-day simple moving average (SMA) on February 26th. Sellers attempted to halt the rally near $64,000 on February 28, but the bulls had other plans.
After some consolidation, buyers resumed the upward trend on March 4th. The sharp rally over the past few days has pushed the Relative Strength Index (RSI) into deep overbought territory.
It’s hard to tell when the market is going crazy. If the bulls hold the price above $69,000, the BTC/USD pair could rise to $76,000 and later $80,000.
However, traders must exercise caution as vertical rallies are not sustainable and are often followed by sharp falls. The first downward support line is $60,000 and the next 20-day SMA is $56,000. A close below the 20-day SMA signals a possible near-term trend change.
ETH/USD market analysis

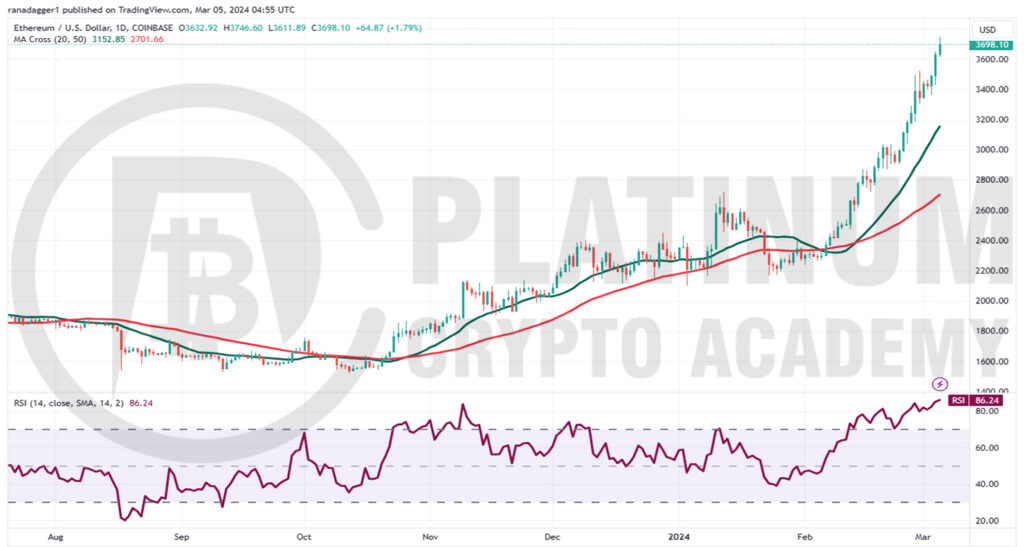
We highlighted in our previous analysis that Ether could reach $3,500 if it does not lose much ground at $3,000, and this is what has turned out to be the case. The bears attempted to halt the rally at $3,500 on February 29th, but the bulls had other plans. They continued their purchases and on March 5 raised the price to $3,700.
The strong rally of the past few days appears to have stretched somewhat in the near term, as RSI is above 86. This suggests that a short-term sideways move or correction is possible.
The first strong support for the downtrend is the 20-day SMA. If the ETH/USD pair bounces from this level, it would indicate that sentiment is still positive and traders are buying on the dip. That would increase the likelihood of a rally to $4,000 and later to $4,400.
Conversely, if the price falls and plummets below the 20-day SMA, it means that the bulls are rushing for the exit. This could deepen the decline to the 50-day SMA and delay the start of the next uptrend.
BNB/USD market analysis

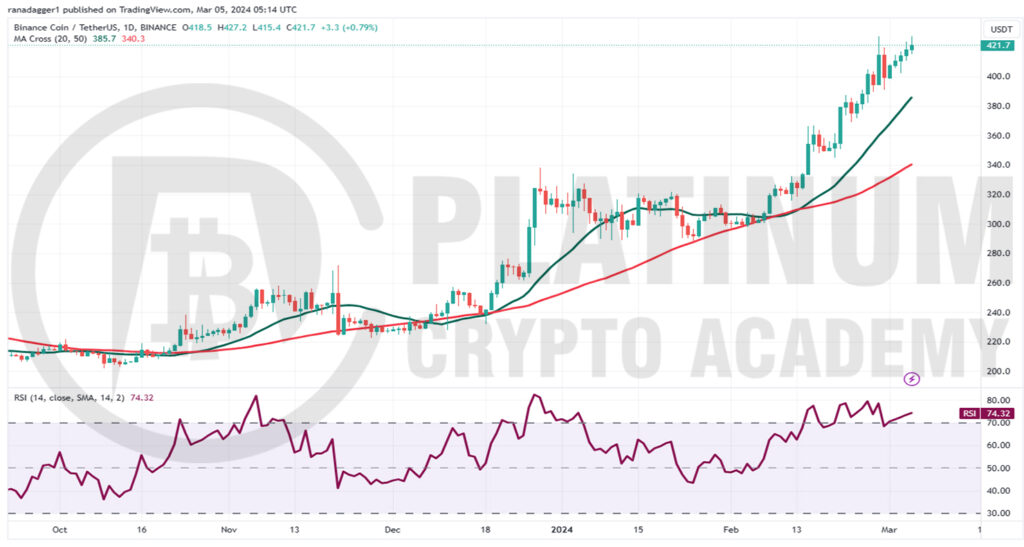
We said in our previous analysis that Binance Coin could reach $400, and it has surpassed that level. The rising moving average and the RSI in the overbought zone indicate that the uptrend remains strong.
If buyers clear the small hurdle of $427, the BNB/USD pair could reach $460. This level is likely to act as a huge hurdle, but if the bulls remain strong, the rally could reach $500.
The 20-day SMA remains an important support level to watch out for on the downside. If the pair bounces off its 20-day SMA, it would indicate that bulls are seeing the pullback as a buying opportunity. This increases the chances of continuing the upward trend.
On the other hand, if the price falls below the 20-day SMA, some short-term traders may rush to book profits. This could intensify selling and push the price down to the 50-day SMA.
XRP/USD market analysis

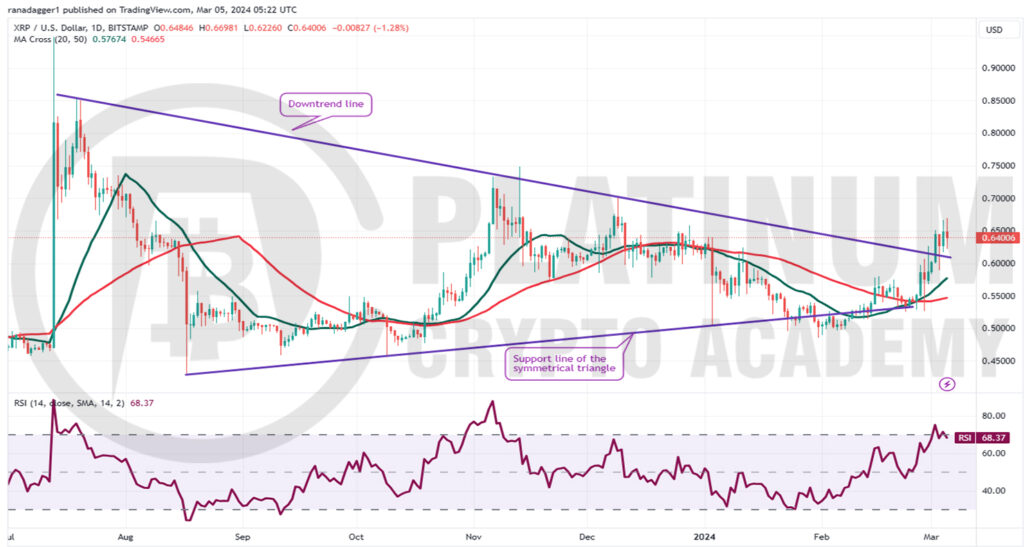
We noted in our previous analysis that buyers have a slight advantage. Bears attempted to pull XRP back below the moving average on February 28, but the long tail of the candlestick shows solid buying at lower levels.
After several days of hesitation, the XRP/USD pair rebounded above the descending trendline of a symmetrical triangle on March 2nd. This means that the uncertainty has been resolved in the buyer’s favor.
But it seems like the bears won’t give up easily. They will try to bring the price back into the triangle. If so, it would suggest that the recent breakout may have been a bull trap. The pair may then fall to the triangle support line.
Conversely, if buyers turn the downtrend line into support, this would indicate solid demand at a lower level. If buyers push the price above $0.67, the pair could reach $0.75 and $0.85 after that.
ADA/USD market analysis

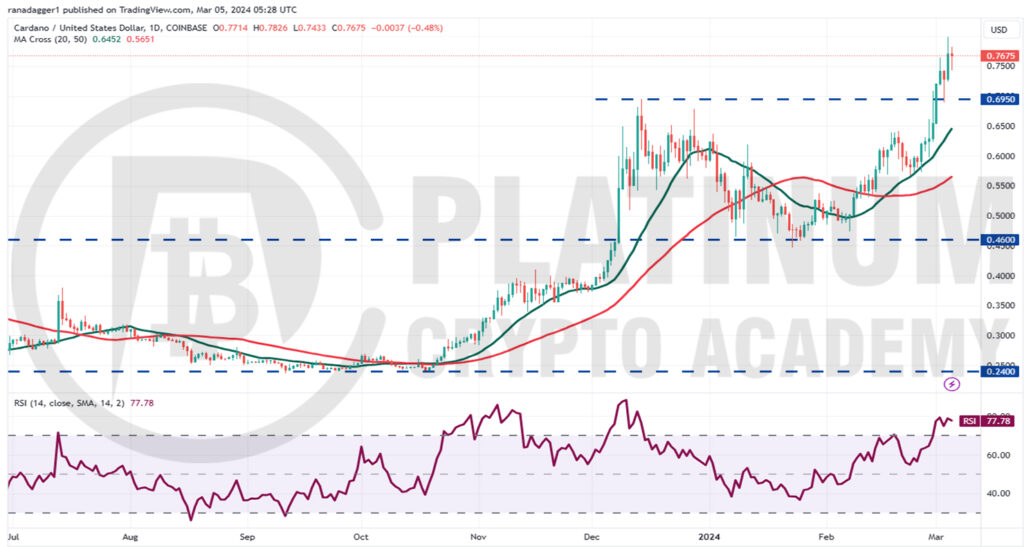
Previous analysis had predicted Cardano to rebound towards $0.90, reaching $0.80 on March 4. The price fell on March 5, indicating that bears are active near $0.80.
An important support to watch on the downside is the $0.70 breakout level. If the bulls turn this level into support, the rally outlook would increase to $0.90. RSI with rising moving averages and overbought zone indicates bulls have the upper hand.
This positive view is invalidated if the price declines sharply and falls below the 20-day SMA. When that happens, it indicates that the trader is in a hurry to sell his position. This could start a deeper decline towards the 50-day SMA.
Hopefully, you enjoyed reading today’s article. Check out our cryptocurrencies. blog page. Thanks for reading! Have a fantastic day! It will be live on the Platinum Crypto Trading Floor.
Import Disclaimer: The information found in this article is provided for educational purposes only. We do not promise or guarantee any earnings or profits. You should do some homework, use your best judgment, and conduct due diligence before using any of the information in this document. Your success still depends on you. Nothing in this document is intended to provide professional, legal, financial and/or accounting advice. Always seek competent advice from a professional on these matters. If you violate city or other local laws, we will not be liable for any damages incurred by you.

