- AVAX is holding at $34.05 with $875 million in 24-hour trading volume.
- There were 542 large transactions in 24 hours, with 59.5% of AVAX holders still making a profit.
Avalanche (AVAX) At press time, it is trading at $34.05, up 0.54% over the last 24 hours and up 1.52% over the past 7 days. 24-hour trading volume was $87.5 million, reflecting continued market interest.
Over the past week, AVAX price has fluctuated within a range of $31.00 to $37.01. Over the last 24 hours, the price has moved between $32.54 and $35.62.
Despite some price volatility, the token has remained within a tight trading range, suggesting traders are closely watching key support and resistance levels for directional clues.
Key levels and technical indicators indicate range-bound movements.
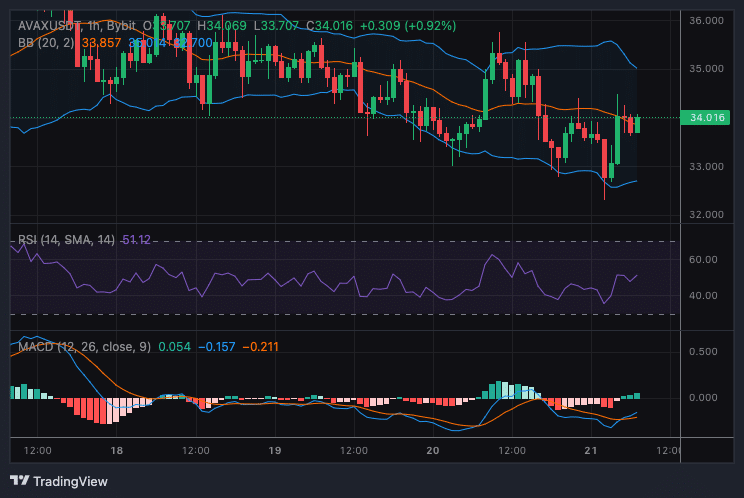
On the 1-hour chart, AVAX has bounced off the lower Bollinger Band near the important support level of $33.00. The price is hovering below $34.85, the upper Bollinger Band, which acts as immediate resistance.
A break above this level could pave the way for further profits up to $35.50 or even $36.00.
Momentum indicators are giving mixed signals. The relative strength index (RSI) is 54, indicating a neutral to moderate uptrend.

Source: TradingView
Additionally, the Moving Average Convergence Divergence (MACD) indicator has turned positive and has recently seen a bullish crossover, suggesting that the upward momentum is likely to continue.
However, the strength of this move is still limited, indicating that a break above $34.85 is needed for a clearer confirmation of strength.
Profitability indicators indicate higher levels of selling pressure.
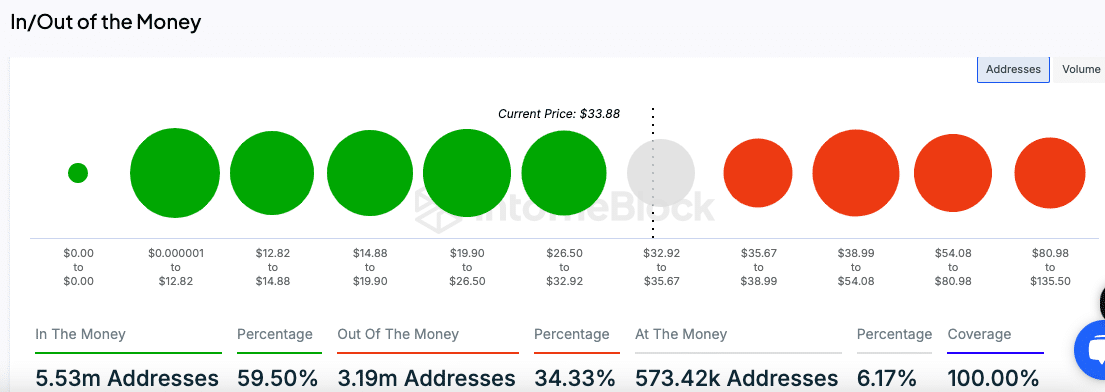
According to the “In/Out of the Money” chart, 59.5% of AVAX holders are currently profitable, with average acquisition costs concentrated between $19.90 and $26.50.
This profitable area can create selling pressure as holders can realize profits as the price rises.


Source: IntoTheBlock
On the other hand, 34.33% of holders suffered losses mainly in the price range between $35.67 and $38.99. These levels represent potential areas of resistance as holders can sell to break even.
Meanwhile, 6.17% of addresses are “At the Money,” which reflects a narrow trading range that closely matches current prices and suggests continued consolidation.
Read Avalanche Price Forecast 2024-2025
Large transaction data reflects moderate activity.
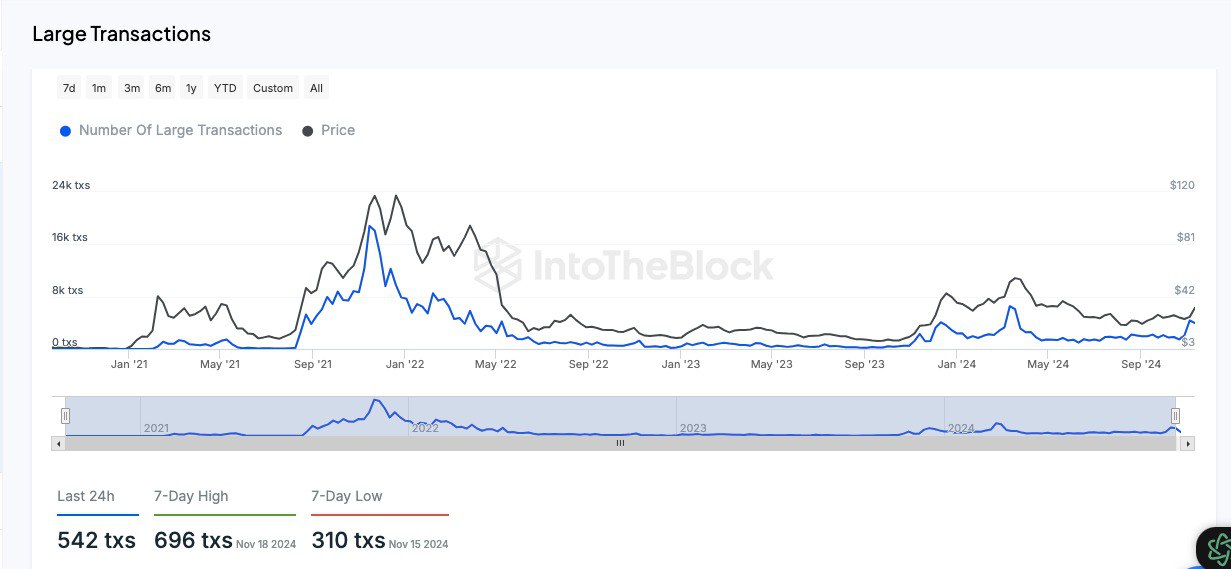
Source of data Into the Block There were 542 large transactions recorded in the last 24 hours, down from a seven-day high of 696. While this reflects moderate activity, an increase in large transactions may indicate renewed interest from larger market participants.


Source: IntoTheBlock
Large transactions, often involving institutions or whale activities, are currently at subdued levels compared to historical highs.

