- LimeWire’s recent rally saw strong buying interest as it broke a key resistance level.
- Buyers should keep a close eye on a potential bullish 20/50-day EMA crossover as it could signal the start of a more extended uptrend.
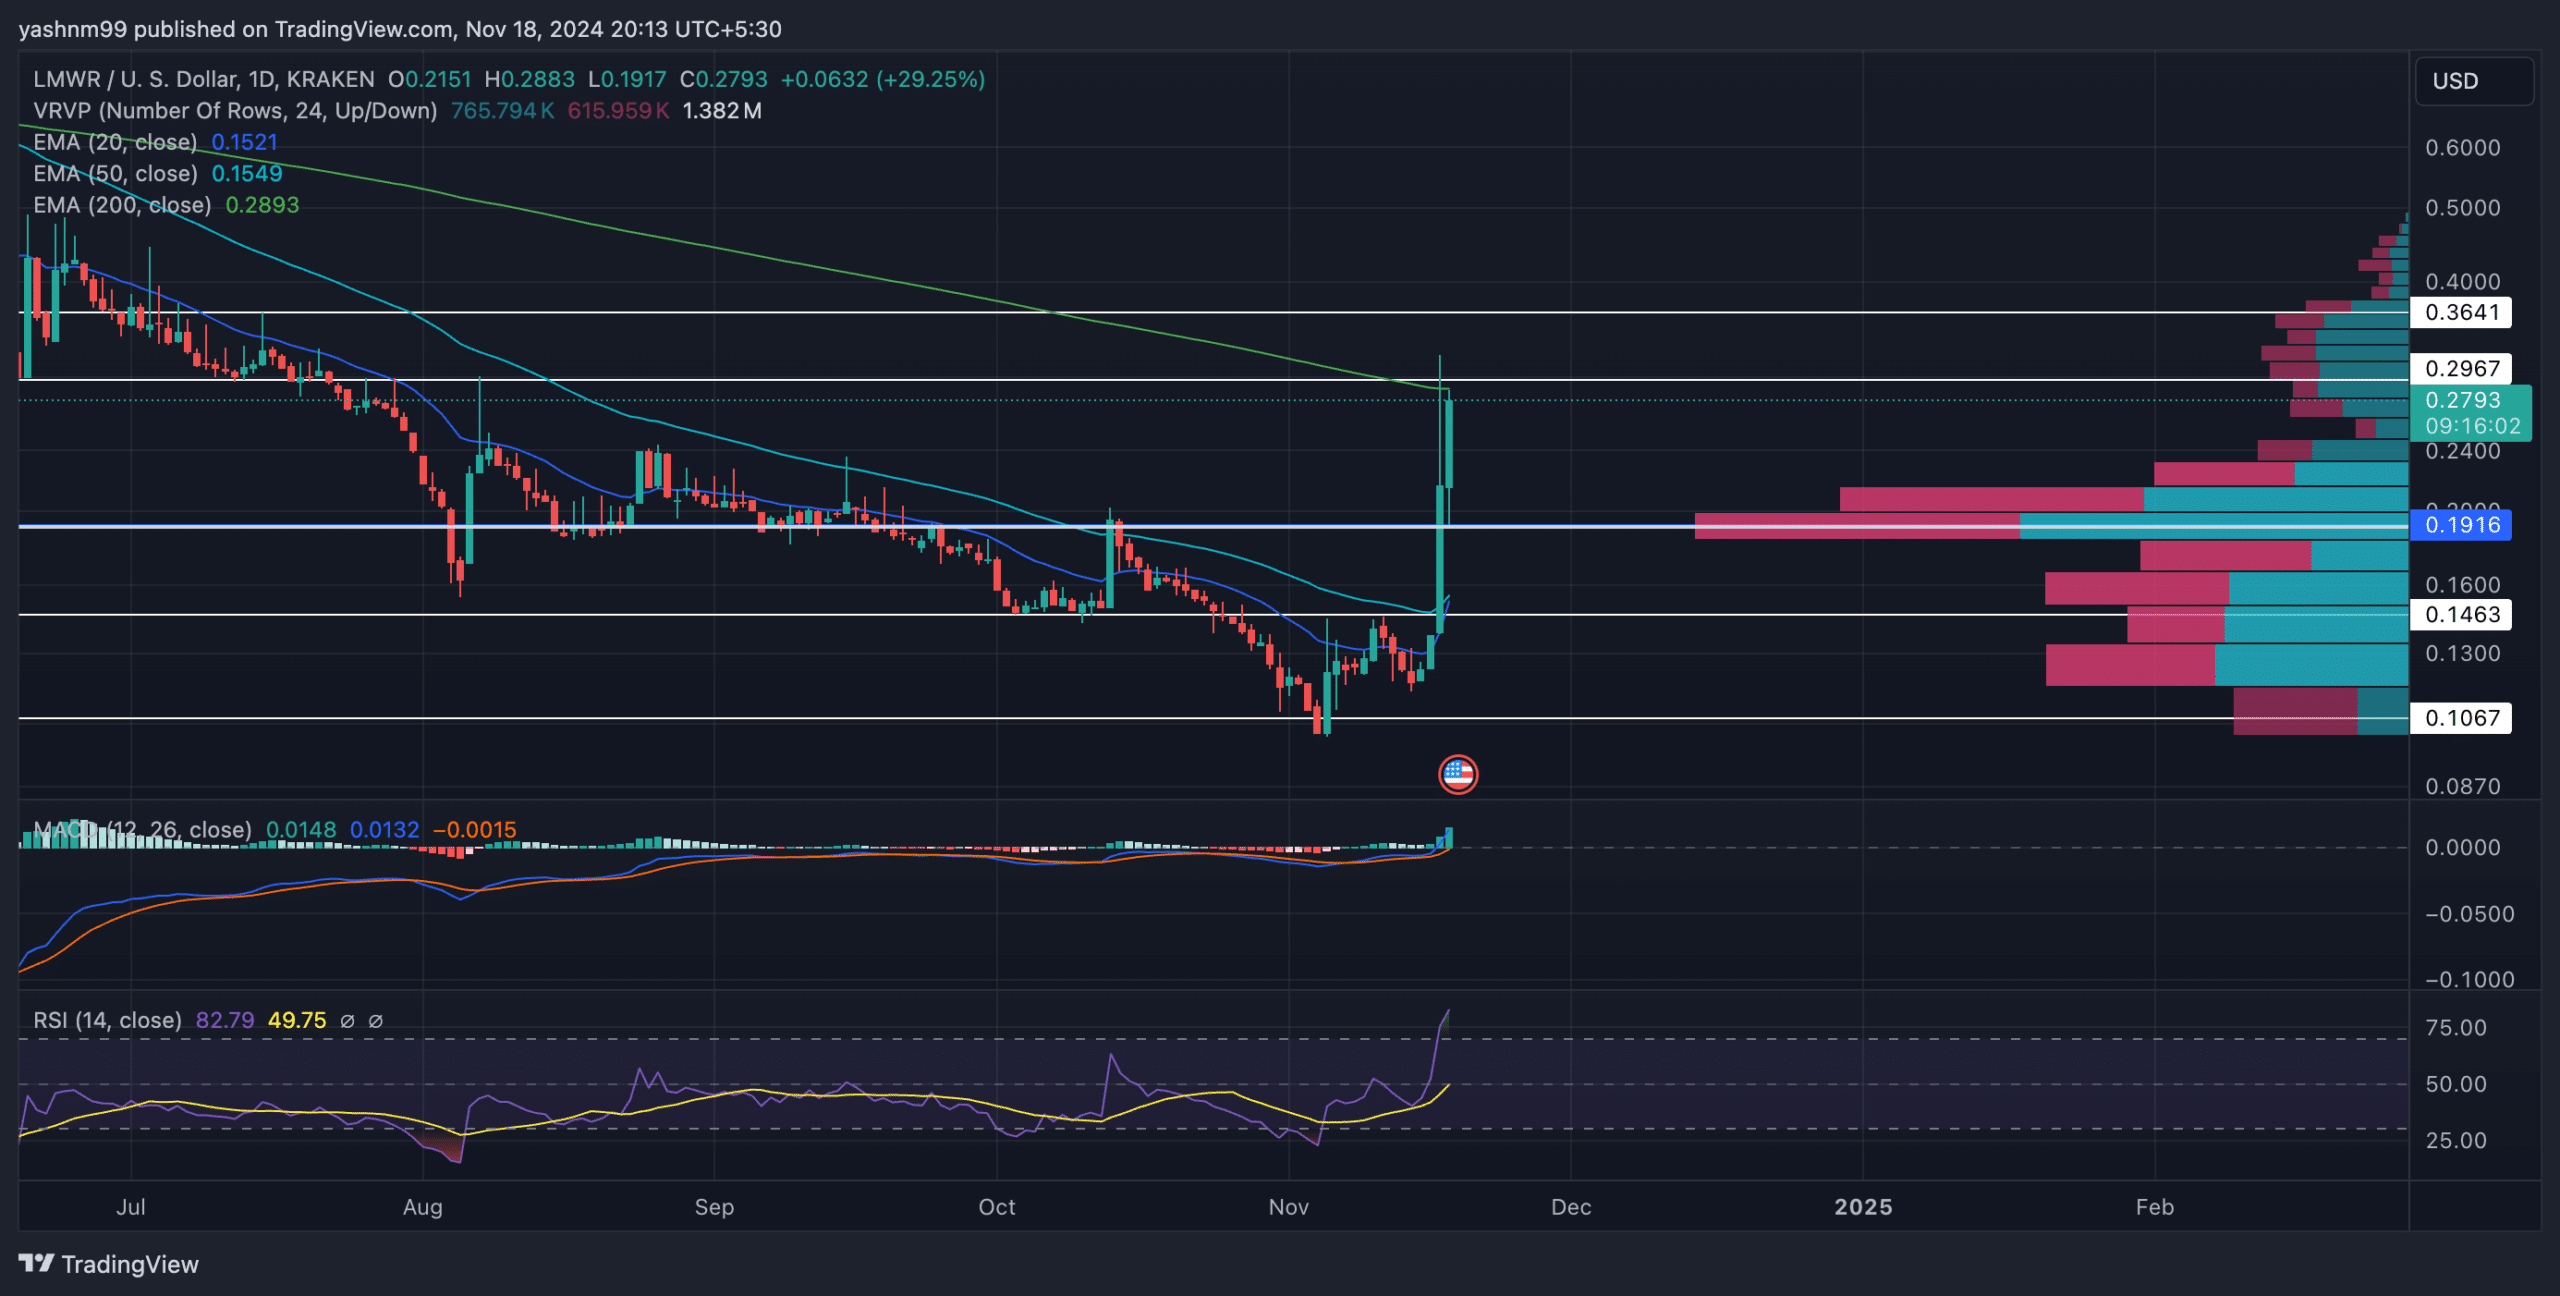
LimeWire (LMWR) has been in the spotlight recently after seeing a massive rally over the past few days. The altcoin surged more than 200% from the November 5 rally, hitting a high of around $0.32 on November 17. This surge caused LMWR to finally break through long-standing resistance and enter the price discovery phase.
At press time, LMWR was trading at around $0.27, up about 65% in the last 24 hours. Price action tested resistance around $0.3 several times but struggled to find a decisive close above this level. Interestingly, the $0.3 resistance level also seemed to line up with the 200-day EMA. This forms an important area to outperform the uptrend.
Can LMWR buyers maintain momentum? Or can the seller take back control?

Source: LMWR/USDT
The recent rally saw LMWR clearing the 20-day EMA ($0.151) and 50-day EMA ($0.1545), and the price is currently attempting to stay above these short-term supports. If LMWR witnesses a bullish crossover of the 20-day EMA over the 50-day EMA, it could pave the way for a more sustainable recovery targeting $0.36 resistance.
However, failure to close above the $0.3 area could lead to a short-term correction, with immediate support remaining at $0.2. At press time, RSI was around 81, indicating that LMWR is in overbought territory.
Therefore, buyers should be a bit cautious here as RSI above 80 could indicate a possible reversal as selling pressure increases.
It is worth noting here that the altcoin’s 24-hour trading volume has increased by over 260%. This jump coincided with a daily gain of over 65%, demonstrating a healthy upward trend. Nonetheless, traders should also monitor Bitcoin’s price movements. Especially since overall market sentiment could influence LMWR’s next steps.
MACD and volume profile analysis
The MACD indicator recently turned positive with the MACD line crossing above the signal line. The MACD line jumped above the zero point while the signal line was on the verge of crossing the balance. A sustained upward trend in these two lines will reaffirm the short-term bullish trend in the LMWR chart.
Lastly, the Visible Volume Profile Range (VPVR) showed a significant area of buying activity between $0.15 and $0.21. This area can act as strong support on the downside.
Conversely, the volume profile shows limited resistance above $0.32, indicating that a clear break above this level could open the door for a quick rally above $0.36.

