Market Outlook #243 (31st October 2023)
Hello, and welcome to the 243rd instalment of my Market Outlook.
In this week’s post, I will be covering Bitcoin, Ethereum, Render, MultiversX, The Sandbox, Arweave and Verasity.
All reader requests this week, which is always good fun – and as ever, if you have any requests for next week’s Outlook, do let me know.
Bitcoin:
Weekly:
Daily:

Price: $34,376
Market Cap: $671.871bn
Thoughts: If we begin by looking at BTC/USD, we can see from the weekly that price closed firmly through the prior 2023 highs at $32.8k on growing volume, pushing as high at $35.2k, below which it marginally closed. This is great confirmation of the uptrend and no doubt we can expect the rest of that gap into $39.6k to get filled in in the weeks to come. However, we are now sat right around the 38.2% retracement of the entire bear market, and so it would not surprise me after two huge weekly rallies to see some sort of consolidation here potentially. If we push back below $32.8k, I’d expect buyers to step in at prior resistance from the April and July range highs, forming a higher-low around that area.
Dropping into the daily, I have marked out the more bullish scenario than a deep pull-back towards $31.4k, which is a shallow pull-back below $33.4k into that channel trendline turning it into support around $33k, then pushing on through $35.2k and up into $37k as a first target, followed by $39.7k. We are starting to see some signs of momentum exhaustion up here, but nothing indicative of a longer-term correction as of yet. I think $31.3k is likely the lowest we see this move in this next week or so if we are to keep squeezing shorts and filling in that long untraded gap. Not much else to add here for now!
Ethereum:
ETH/USD
Weekly:
Daily:

ETH/BTC
Weekly:

Daily:

Price: $1801 (0.05237 BTC)
Market Cap: $216.636bn
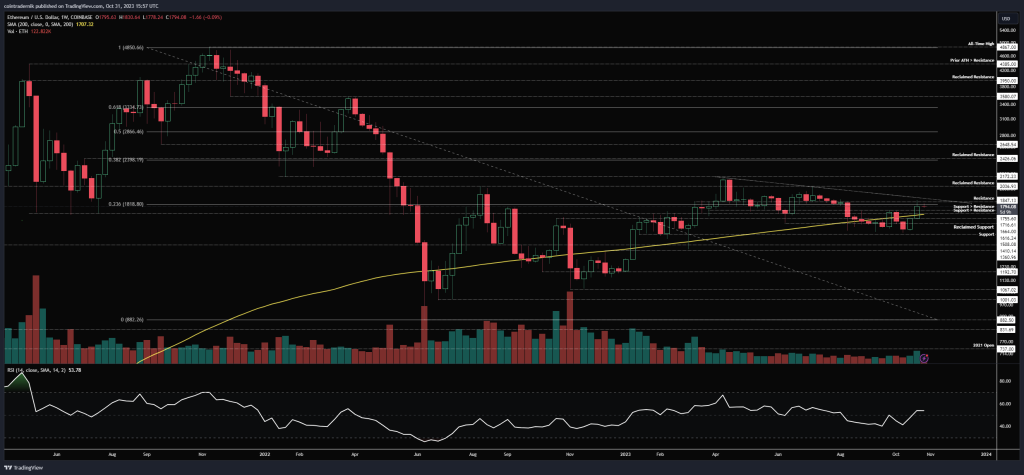
Thoughts: Looking at ETH/USD, from the weekly we can see that price has pushed up through resistance at $1755 and turned weekly structure bullish, reclaiming the 200wMA but finding resistance at the cluster of resistance between $1850 and trendline resistance from April 2023. Weekly momentum is also now beginning to lean towards bulls, but this is a huge hurdle to overcome on the first attempt. The fact we now have bullish weekly structure, however, means we can look to play longs with higher probability now if we pull back from this area back towards the range between the 200wMA and $1755 – that’s where I think we can find a lot of value for long exposure with a view to add on a clean break and close above the trendline. If we do see that breakout and acceptance above it, I think we continue towards $2425 to play catch up with BTC. Turning to the daily, we can see how the current range is that $1755 level as resistance turned support and $1847 as resistance, and I would be keen to long a sweep of $1755 into $1716 and then add above $1850 as mentioned for a longer-term swing position. As long as we now hold above $1616 though, I think the momentum has shifted in favour of the bulls, even if ETH is underperforming BTC at present.
Turning to ETH/BTC, we can see just how much it is underperforming here, with last week selling off from the open through the 200wMA and May 2021 lows all the way into 0.051, above which it marginally closed, but with price now sat in no man’s land with multi-year range support potentially now turning resistance, and only the swing-low at 0.0487 below to support price within this past 2 years of price-action. If we drop into the daily, we have some minor divergence into this most recent low but price is just chopping around below 0.0533 and above 0.051. What bulls want to see here is a strong push off this low back above 0.055, accepting back above it as support. In that scenario, the bottom is very likely in for a long time to come and we would expect some sort of sustained reversal into the trendline from there. In the bearish scenario, 0.0533 continues to act as resistance this week and price closes below 0.051, falling from there to fill in the wick into 0.04877. It may be that we need a sweep of that swing-low before we can get any momentum for a reversal, but accepting below that would be a very bad sign indeed for ETH/BTC.
Render:
RNDR/USD
Weekly:
Daily:
RNDR/BTC
Weekly:
Daily:

Price: $2.34 (6817 satoshis)
Market Cap: $871.389mn
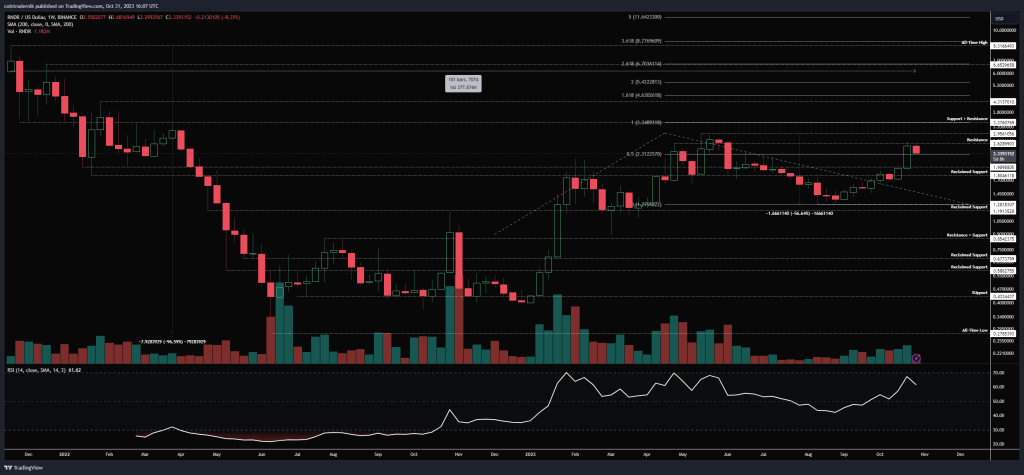
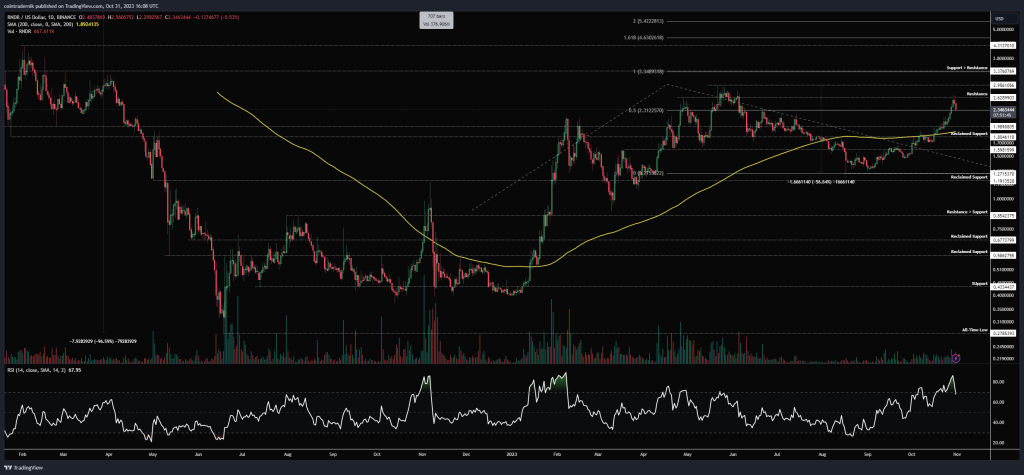
Thoughts: If we begin by looking at RNDR/USD, we can see on the weekly that price rallied last week right into resistance at $2.63 that capped the pair back in April, closing marginally below it on growing volume, with no signs of momentum exhaustion on this timeframe. The pair has retraced a little early this week off this resistance, but we have been in a macro uptrend since last year; if we look at a trend extension, we can see that $3.35 would be the next area of interest, followed by $4.60, both of which align with historical levels of significance. Any pull-back here is an opportunity to get long, in my view, as long as this can now hold above $1.80. Close the weekly below that and it becomes more likely that we retrace back into the August lows at $1.28. As soon as we close the weekly above $2.63, I think we blast through $3 into that $3.35 area.
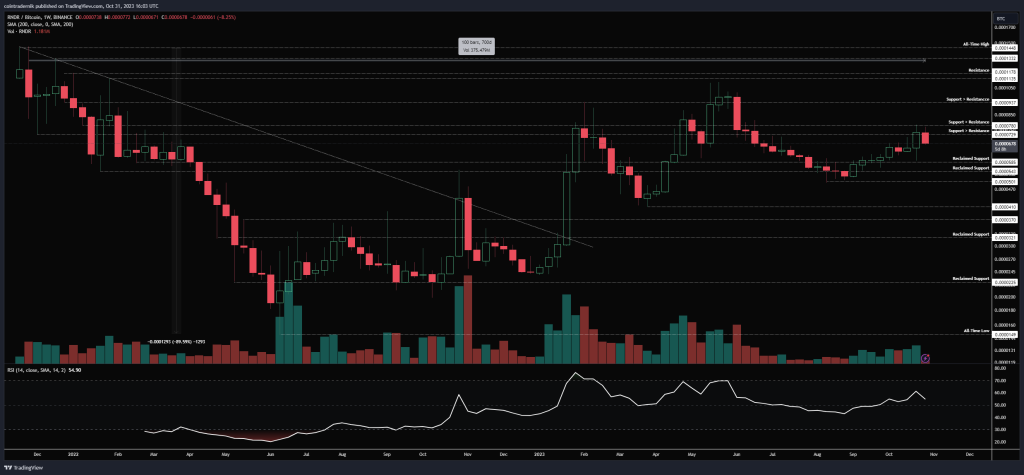
Turning to RNDR/BTC, we can see that price reclaimed support at 5850 satoshis and bounced off that into support turned resistance at 7800, now consolidating within last week’s range. If we drop into the daily for more clarity, we can see that this retracement is taking price right back into prior resistance and the 200dMA, so this may be the extent of the pull-back right here. However, close below this level and I think we squeeze lower into 6220, which would be a nice spot to jump in, with invalidation on a close below 5850. Above 7800, there is literally no resistance back into 9370 satoshis, so definitely one to keep an eye on in November.
MultiversX:
EGLD/USD
Weekly:

Daily:

EGLD/BTC
Weekly:
Daily:

Price: $29.59 (86,070 satoshis)
Market Cap: $773.589mn
Thoughts: If we begin by looking at EGLD/USD, we can see that the pair has been bleeding lower at a less steep rate for the past year than it did through 2022, but we remain suppressed by trendline resistance from the September 2022 highs. That being said, for the past couple of months, the pair has been in a tight consolidation range between historical resistance turned support at $22.94 and support turned resistance at $28.33, closing above that resistance last week. This is exactly the historical area in which we’d want that tight range to form and we are now pressing right up against trendline resistance once again, with momentum now pushing higher. What bulls need to see here is a weekly close through trendline resistance and back above $33.30 – if that occurs, I think it is looking likely that the bottom has formed here and we can expect price to begin pushing towards $52, followed by $66.45. Dropping into the daily, we can see how the 200dMA is also capping price right here, providing confluence for the important of a breakout. I would love to be a buyer of this above $33 with a view to add above $38 and looking to hold for the next cycle.
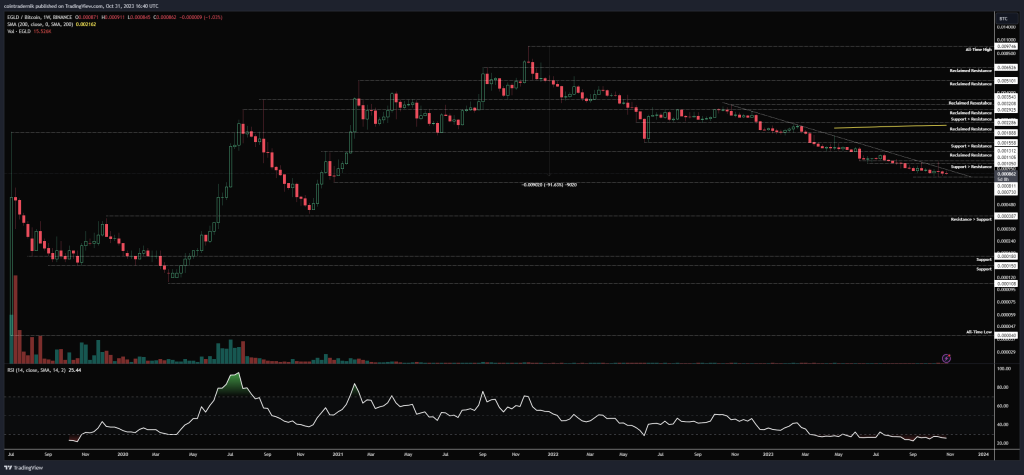
Turning to EGLD/BTC, the pair continues to bleed lower, now finding support at 81.1k satoshis but rejecting numerous attempts at a trendline breakout, with that trendline now pressing against price again. If it fails here, naturally the downtrend persists and we move lower into 73k satoshis as the next level of support. However, what is kind of insane here is that there is no support at all for the pair below that level all the way back onto the December 2020 bottom at 38.7k satoshis, so this is a really important area for EGLD. Given how the broader market and the dollar pair are looking, I would be very surprised if we close below 73k satoshis, rather expecting some sort of bottom to begin forming within the next 20% move lower. But let’s see how November price-action unfolds…
The Sandbox:
SAND/USD
Weekly:
Daily:

SAND/BTC
Weekly:

Daily:

Price: $0.34 (989 satoshis)
Market Cap: $704.090mn
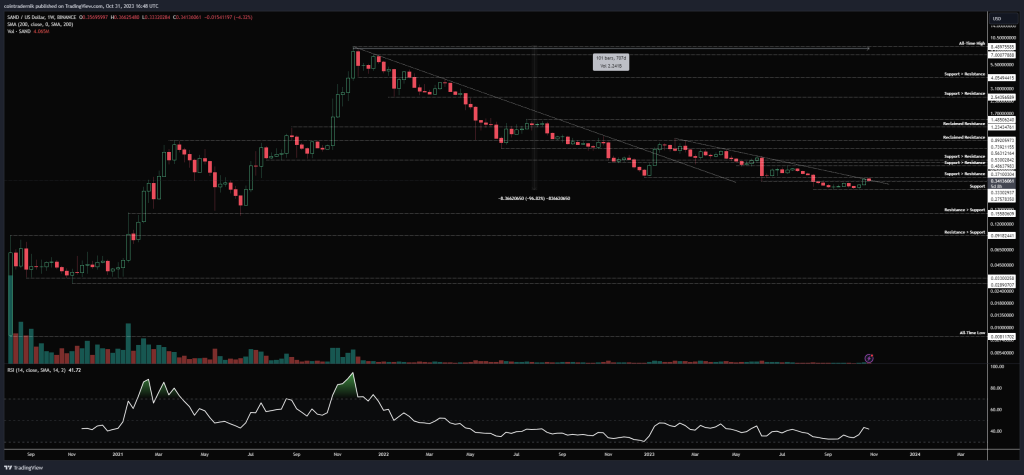
Thoughts: Beginning with SAND/USD, we can see that price-action looks very similar to EGLD/USD, with that recent diminishing volatility and tight consolidation range, followed by last week’s close right around trendline resistance. We are now sat on the trendline and below the December 2022 lows at $0.37 but bulls want to see a clean weekly close above this level to start getting excited. If we see that, we can look to play longs for the next 30% move higher towards that $0.49 resistance level. If we drop into the daily, we can see with more clarity that we actually rejected the trendline but price is sat above reclaimed support here at $0.33. This is not where I would jump in, as if this level fails, we have little support back towards the bottom of the range. Rather, I would like to see price close accept above $0.37 as reclaimed support and then look to buy with a close back below it as invalidation for that range play higher into $0.49.
Turning to SAND/BTC, we can see that price is still pushing lower, now sat in no man’s land between prior support at 1120 satoshis and support at 784 satoshis. I would expect to see that 784 area to act as support if we do push lower into it from here, but ultimately bulls want to see momentum begin to show exhaustion down here. If we look at thee daily, we can see there is some divergence here and volume starting to push in, but no follow-through as of yet. A clean push and close through 1120 would begin to look promising and we could expect 1275 to follow from there, with no resistance above that all the way into 1554 satoshis. Longer-term, we are still well below trendline resistance here, so only looking for the short-term plays.
Arweave:
AR/USD
Weekly:
Daily:

AR/BTC
Weekly:

Daily:

Price: $5.80 (16,884 satoshis)
Market Cap: $379.273mn
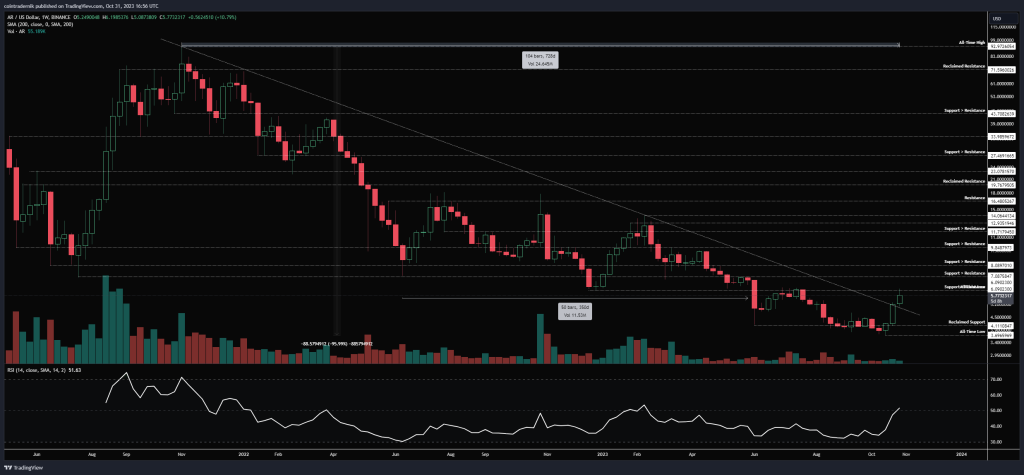
Thoughts: If we begin by looking at AR/USD, we can see that after a 728-day bear market, the pair has finally pushed through trendline resistance after a 96% drawdown, printing a fresh low at $3,70 only 3 weeks ago before that acted as a spring for a reclaim of $4.11 and the subsequent push higher. The pair is now finding resistance at prior support from December 2022 at $6.10 but as long as it can hold above the weekly open at $5.25 we have a weekly trendline breakout with weekly momentum also pushing in favour of the bulls. Dropping into the daily, we can see how the 200dMA has also now been closed above, but I would not be surprised to see price now turn lower from this resistance to form a higher-low above that trendline. I would look to buy spot on that pull-back, if we get it, with my invalidation at $4.70 – lose that level and it no longer looks attractive to me on any timeframe. This is to hold for potentially 12 months…
Turning to AR/BTC, we can see that weekly momentum is diverging as price bleeds lower, printing a strong reversal candle into that all-time low at 12.5k satoshis. That led to continuation higher back above 16k, and bulls want to see that level act as reclaimed support this week. Close the weekly above that and I think we have formed that cyclical bottom, and we can expect out performance from there all the way back into 24k before we find much major resistance. And a weekly close above 24k satoshis is the signal for disbelief, in my opinion. Very clean structure here. Looking briefly at the daily, that range between 15.3-16.1k satoshis should really act as support this week now that the pair has cleared it out with such momentum; form a higher-low in that area and I think this keeps squeezing higher into 20.9k next week.
Verasity:
VRA/USD
Weekly:
Daily:

VRA/BTC
Weekly:

Daily:
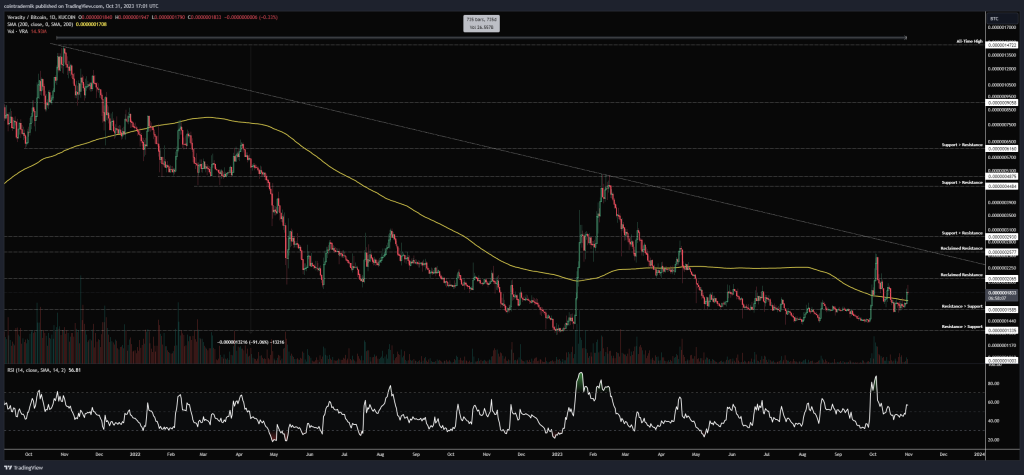
Price: $0.0063 (18 satoshis)
Market Cap: $64.624mn
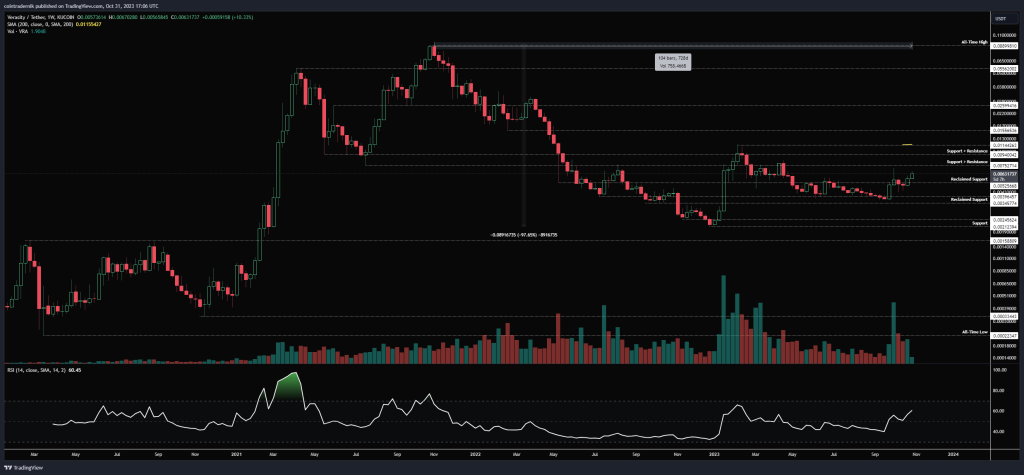
Thoughts: Beginning with VRA/USD, we can see that price formed the cyclical bottom back in December 2022, from which the pair rallied over 400% into $0.011 and has since been in its first correction since, bleeding for months until it formed a low above reclaimed support at $0.0035 in September. That led to a high volume rally and break back above $0.0053, with weekly structure turning bullish again and price now looking to begin its next leg higher, with $0.0075 as the next area of resistance to overcome. Whilst this holds above $0.0035, it is clear that the first major correction of a new bull cycle is over, and we can expect the pair to continue towards the $0.011 high and the 200wMA from here in the coming months; close the weekly above that and I think we squeeze into $0.0155, followed by $0.026.
Turning to VRA/BTC, we have been consolidating above those December 2022 lows for months, then rallying to reclaim support above them at 16 satoshis, which held firm last week. That is the most important level here now, given the structure beginning to form here. Bulls want that to hold as a higher-low, from which we would expect continuation higher through reclaimed resistance at 26 satoshis into the 200wMA at 30 satoshis; close the weekly above that and there is no resistance back into the 2023 highs at 46 satoshis. Not much else to add here as this is some of the cleanest market structure I’ve seen. As long as there is no weekly close below 13 satoshis VRA is in a new bull market.
And that concludes this week’s Market Outlook.
I hope you’ve found value in the read and thank you for supporting my work!
As ever, feel free to leave any comments or questions below, or email me directly at nik@altcointradershandbook.com.

