Market Outlook #244 (7th November 2023)
Hello, and welcome to the 244th instalment of my Market Outlook.
In this week’s post, I will be covering Bitcoin, Ethereum, Solana, Blur, Metis, LooksRare and Hathor.
Will be publishing a slightly longer Outlook next week, so if you have any requests, let me know.
Bitcoin:
Weekly:
Daily:
Price: $35,081
Market Cap: $685.304bn
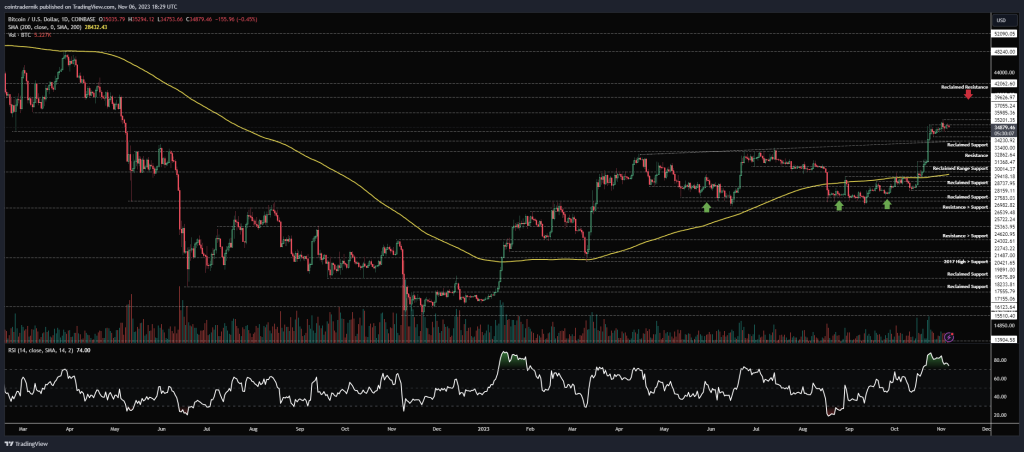
Thoughts: If we begin by looking at BTC/USD, we can see that price closed last week marginally above the prior weekly close, though on lower volume, rejecting at $36k and now consolidating right below that level. Nonetheless, we have a clear weekly breakout beyond channel resistance from most of 2023 and acceptance above $33.4k reclaimed support. Whilst the weekly holds above that area, it’s likely we continue to squeeze higher, with obvious targets marked out at $37k, $39.6k and the 50% fib retracement at $42k. However, if we drop off this week after another rejection of $36k, this may mark out a short-term top, and closing the weekly back below $33.4k would make a deeper retracement inevitable, potentially as low as the 200wMA at $28.7k. Nonetheless, the pair would still be bullish even if we retrace into that area in the coming weeks, so there’s very little here to suggest that bears are taking control.
Looking at the daily, we can see some momentum exhaustion as we push higher up here into resistance, which is promising for shorts expecting some downside here. If we poke above $35.2k and reject below $36k I would also look at opening up shorts to clear out the past week of price-action back into $33.4k. Obviously, acceptance below $33.4k opens up that prior resistance at $31.4k as a target to turn into fresh support, as it is currently untested. For the bulls, this momentum divergence could be invalidated if we accept above $36k and print a higher-high on RSI to accompany it. Not much else to discuss here for now…
Ethereum:
ETH/USD
Weekly:
Daily:

ETH/BTC
Weekly:

Daily:

Price: $1900 (0.0542 BTC)
Market Cap: $228.674bn
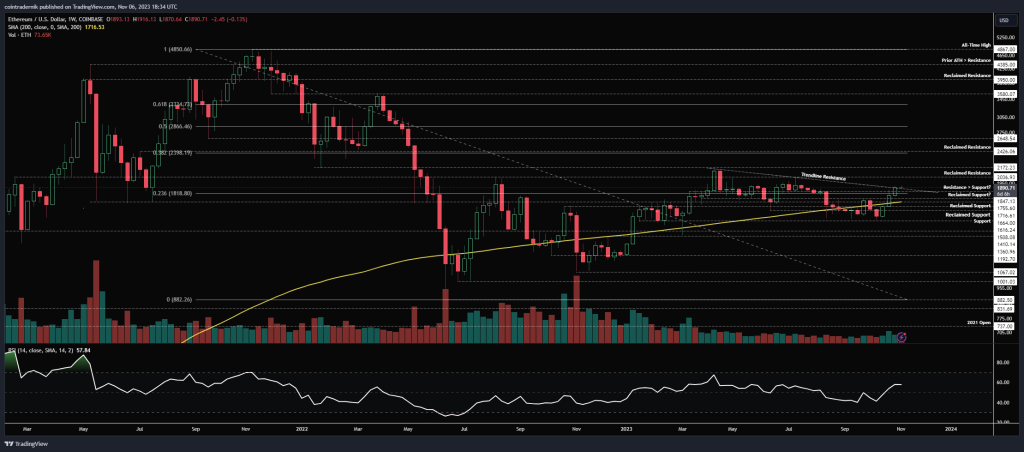
Thoughts: Beginning with ETH/USD, we can see that price has pushed up into trendline resistance that has capped the pair most of 2023, closing marginally above it last week and now sitting right on it. We are also back above that $1847 local pivot and if ETH can hold above that level this week and turn this trendline into support, I think we continue squeezing into the next major resistance at $2037. If, however, we close back below $1847 this week, the local top is likely in here, but we have bullish market structure to fall back on, and I would then expect to see that $1717 area to be retested as support before continuation higher. Dropping into the daily, again we have the makings of some momentum exhaustion here on the breakout beyond the trendline, potentially invalidating it; the next couple of days will be telling, as any continuation higher into $1957 would look like acceptance of the breakout and invalidation of the diverging momentum, but a move back below $1847 would make for a lovely short setup for a dump into $1755 as a first target, followed by $1717. Really nice structure here for trade setups this coming week.
Turning now to ETH/BTC, we can see that price found support above 0.051 last week but fell short at the 200wMA, rejecting it at 0.055 as resistance. If that level acts as resistance this week, I think we erase the past week’s gains and run that June 2022 low at 0.0488. However, weekly close back above 0.055 and things begin to look more exciting for ETH, as we can then look for a period of outperformance back towards that trendline, in my opinion. Turning to the daily, what bulls want to see is a higher-low form this week above 0.0533 and that act as the base for a push back above 0.0552. If we see that, bull goggles on for ETH/BTC until at least 0.0594 I think.
Solana:
SOL/USD
Weekly:

Daily:
SOL/BTC
Weekly:
Daily:

Price: $40.43 (0.00115 BTC)
Market Cap: $16.989bn
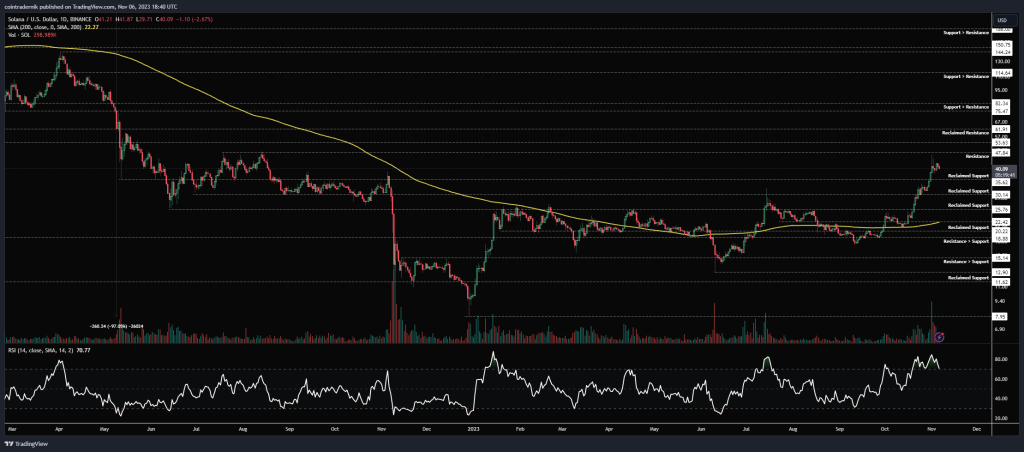
Thoughts: Beginning with SOL/USD, we can see from the weekly that price has continued its uptrend with another push higher through multiple resistance levels last week, with momentum continuing to lean in favour of more upside. We broke through $35 and pushed all the way into $48, where the pair found resistance, now consolidating between those two levels. There’s no doubting the trend here, but we have just pushed up into the bottom end of a large resistance cluster after a multi-week rally, so it would not surprise me to see price retest $35.60 this week as support. If we look at the daily, we can see that there isn’t the same momentum exhaustion as there is on ETH and BTC but price is looking ready to push further towards $35.60 over the next few days. If we do get that opportunity, I would look for longs close to that level with a very tight invalidation on acceptance below it, expecting another crack at $48 in the next couple of weeks. Above that level, I think we find some more resistance at $53.60.
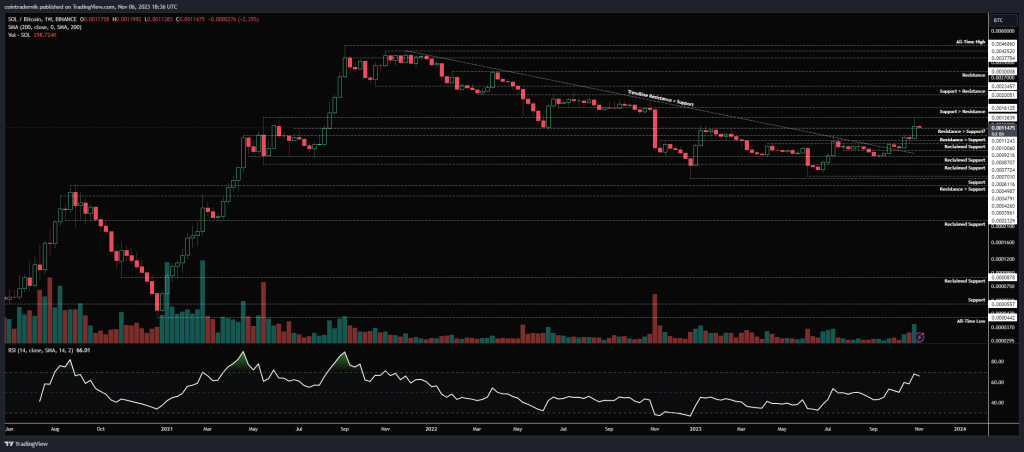
Turning now to SOL/BTC, we have continuation higher after a consolidation week and resumption of the uptrend following the huge trendline breakout. Price pushed off the weekly open through 0.00112 into 0.00136 and rejected, now sat right at that 0.00112 area. This has historically been a key level of support and resistance for SOL, so it would be a strong show from the bulls to hold above it this week, with the likelihood then being a breakout through 0.00136 and gap fill into 0.00161. Looking at the daily, if we do lose this level this week, we have prior resistance left untested at 0.001 that would be the area to hold, and would potentially align nicely with a $36 entry on the Dollar pair. Let’s see how the week unfolds, but no doubt where SOL is headed going into 2024.
Blur:
BLUR/USD
Daily:

BLUR/BTC
Daily:
Price: $0.385 (1099 satoshis)
Market Cap: $408.323mn
Thoughts: As Blur has only been trading for half a year, both pairs look identical and I will focus here on BLUR/USD.
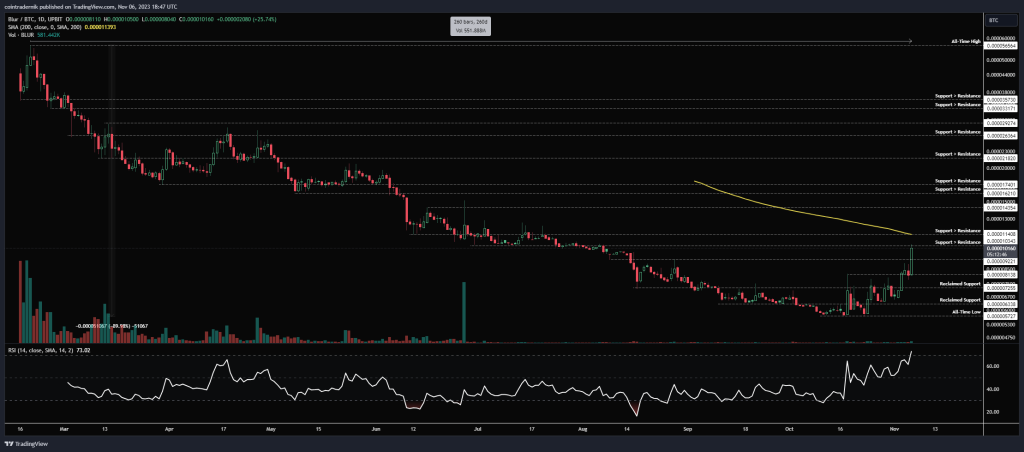
Looking at BLUR/USD, we can see that price was in a bear market from inception through to October 2023, retracing 89% from the all-time high before forming a capitulation low at $0.155 in August and then sweeping that low in October. Following the sweep, we saw the pair rally off the bottom through trendline resistance that had capped price since that all-time high formation back in February. The trendline breakout held firm, with price finding support above it at $0.18 in October, and we have since begun an expansionary move, clearing reclaimed support at $0.20 and turning resistance into support at $0.24. In November, the pair has continued to push higher, rallying through the June lows at $0.29 and the 200dMA at $0.33 into $0.37, around which it is currently sat. From here, we have some resistance ahead at $0.40 but price is now within this larger range between $0.29 as support and support turned resistance from the earliest trading days at $0.48. I would expect to see a continuation of this squeeze into that major resistance cluster before a local top forms, but it is quite clear that we have begun Blur’s first bull cycle at this point. If you are on the sidelines looking for an entry, I would wait for a top to form somewhere between $0.40-0.50 and then look for a pull-back towards the 200dMA in the coming weeks. For those of us with a position, I am looking to hold into fresh all-time highs in 2024.
Metis:
METIS/USD
Weekly:
Daily:

METIS/BTC
Weekly:
Daily:
Price: $16.33 (46,552 satoshis)
Market Cap: $70.935mn
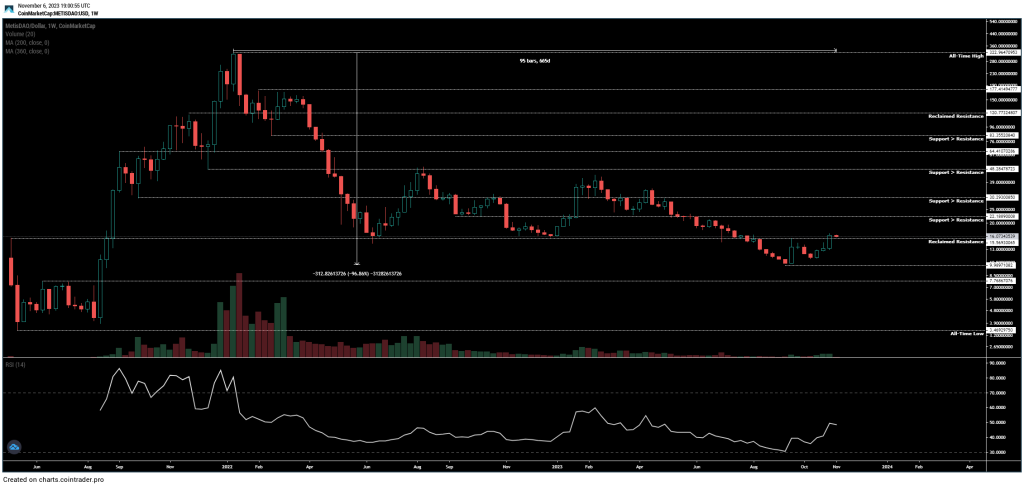
Thoughts: If we begin by looking at METIS/USD, we can see from the weekly that price had formed a year-long bottom at $15.57 before closing below it in August, printing a fresh cycle low around $10. Price then rallied sharply off that low, found resistance back at $15.57, formed a higher-low and is now tackling that all-important level once again, marginally closing above it last week. If the pair finds acceptance above this level and reclaims it as support, I think the cyclical bottom is in, and we have just see the spring formation from which a disbelief rally will emerge. In that scenario, I want to see this squeeze higher towards $22 and then look to buy a pull-back as close to $16 as possible, with invalidation at $9.90 and a view to hold for another cycle. Obviously, if we reject again up here, it is likely we continue to fall, and we could look at $7.77 as an area of interest for a bottom formation. If we briefly drop into the daily, we can also see that price is pressed right up against trendline resistance form throughout 2023 and the 200dMA, so a strong move through all of this resistance would be a promising sign indeed.
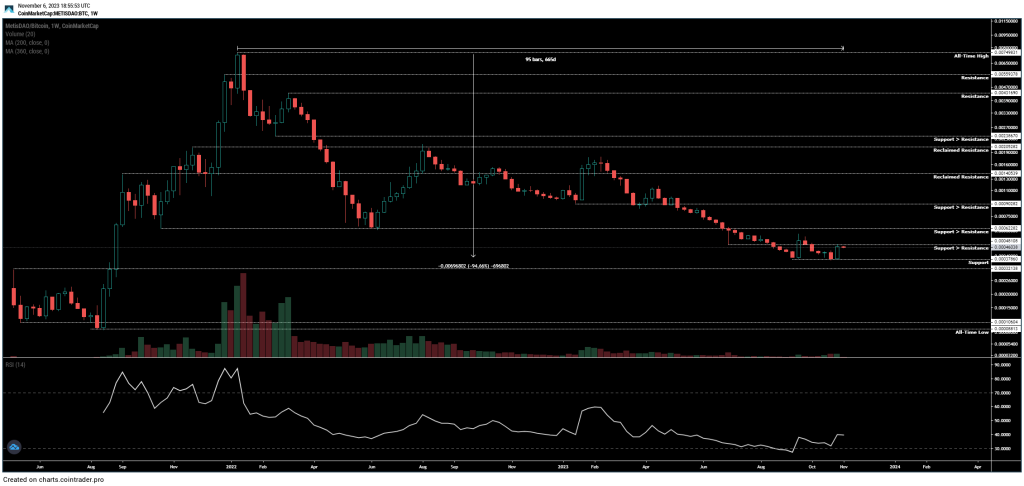
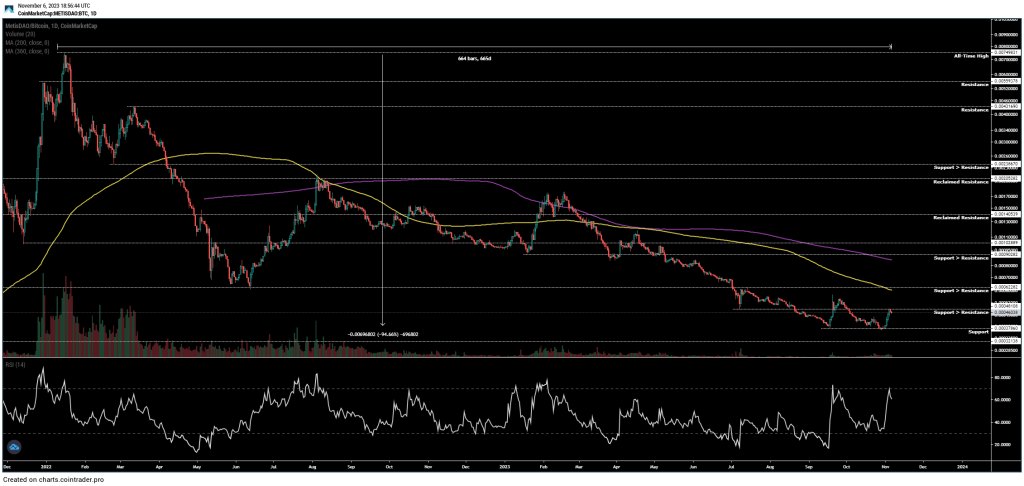
Turning to METIS/BTC, we can see that the pair has formed a double bottom above support at 37.8k satoshis and is now pushing up into support turned resistance at 48k, with momentum looking to swing in favour of bulls down here. We are marginally above another key level of resistance turned support at 32k, and if the pair can close the weekly through 48k here I would expect to see continuation into the multi-year support turned resistance at 62.3k satoshis. That’s the level bulls should be most concerned with here; close above that on the weekly and I think it is looking very promising for the coming months, but whilst we are below that there is every chance the downtrend persists and METIS continues to underperform vs BTC. If we drop into the daily, we can also see how that 62.3k area aligns with the 200dMA, providing confluence for the significance of reclaiming that level as support.
LooksRare:
LOOKS/USD
Daily:

LOOKS/BTC
Daily:

Price: $0.095 (271 satoshis)
Market Cap: $51.683mn
Thoughts: I will focus here on LOOKS/USD, as both pairs look virtually identical and this is also the pair I am focusing on for my long-term position.
On the daily chart for LOOKS/USD, we can see that price had formed a multi-month range between support at $0.05 and support turned resistance at $0.068 between June and October, deviating below that range to form a fresh all-time low at $0.043 but reclaiming the support. Since October, the pair has broken beyond range resistance and above the 200dMA, squeezing now towards the 360dMA and November 2022 lows at $0.114. Now, last time we emerged above the 200dMA, this was a fake-out and price continued its bear trend from there, so I am hesitant to get over-excited yet, but price-action here is promising, particularly after a 99% drawdown from the all-time highs. If that multi-month formation and deviation into $0.043 was indeed the bottom, we should see a local top potentially form below $0.115 and price to then form a higher-low above both $0.068 and the 200dMA. From the formation of a higher-low, any close back above that $0.114 level begins to look very much like the cyclical bottom has finally formed, and from there it is likely we continue to rally over the coming months into the major resistance levels marked out, with varying degrees of pullback depending on the context of the broader market. If, however, we reject here and then close back inside $0.068, this once again looks like a deviation of the 200dMA and those all-time lows would be on the cards once again.
Hathor:
HTR/USD
Weekly:
Daily:

HTR/BTC
Weekly:
Daily:

Price: $0.063 (177 satoshis)
Market Cap: $15.424mn
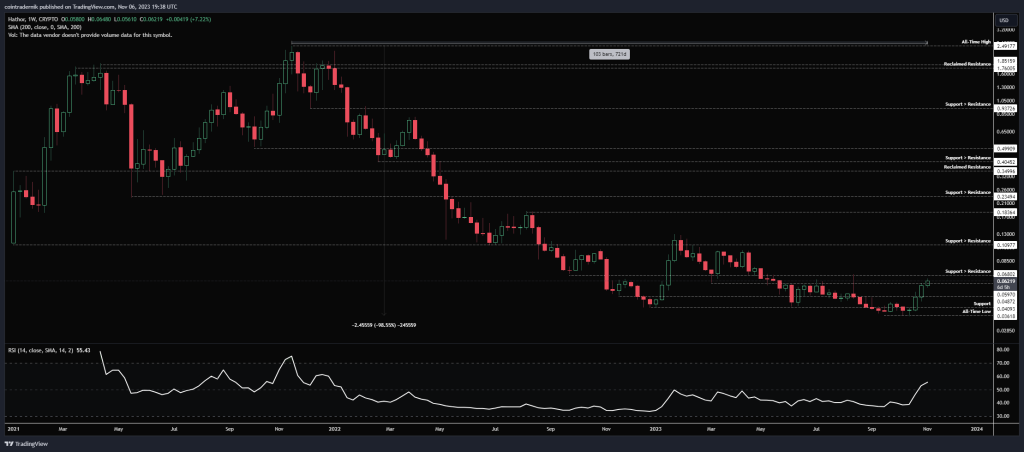
Thoughts: Beginning with HTR/USD, we can see from the weekly that price recently swept the December 2022 low at $0.041 into a fresh all=tome low at $0.036 and reversed sharply, rallying for 3 weeks and reclaiming multiple levels of support, now pushing into support turned resistance at $0.068. This is exactly what bulls want to see following that all-time low sweep, with that now looking like a deviation followed by a reclaim of major support. I would expect some resistance to now be found in this area and price to then look to form a higher low above $0.0487. Form that higher-low and then close the weekly through $0.068 and we have a nice 50% range above that into major historical support turned resistance at $0.11, which will be the biggest test for the pair. I would look to buy either a pull-back into $0.05 and then add above $0.068 or simply buy the reclaim of $0.068 as support if we don’t get the pullback, selling at $0.108 and waiting for acceptance above that huge level before jumping back in for a cyclical play.
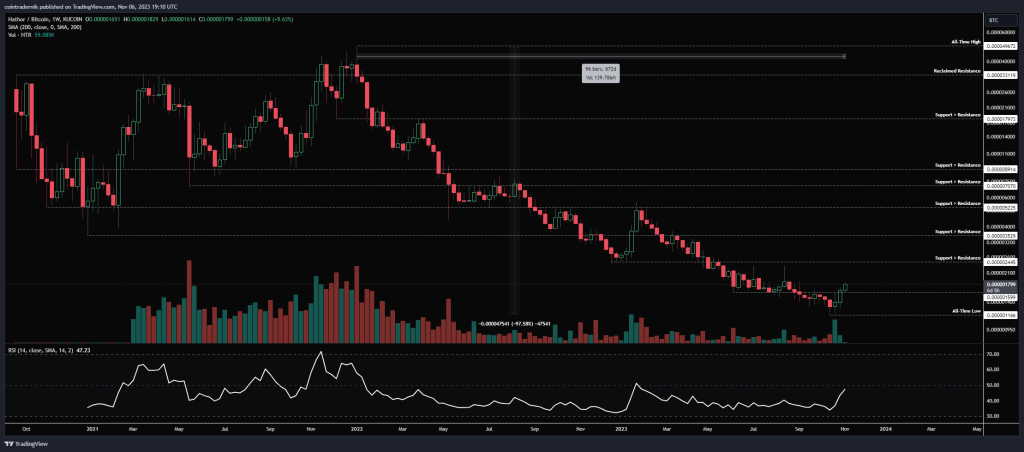
Turning to HTR/BTC, we can see how price had continued to break fresh all-time lows into late October, forming a low at 116 satoshis before rallying off that bottom and now reclaiming the June-August support at 160 satoshis. Whilst we still have bearish structure on the weekly here, this is a promising start on decent volume off the lows, with momentum also looking like it is kicking in. That said, bulls want to see this continue to squeeze towards 245 satoshis and then form a higher-low above 160 to gain confidence that the bottom is in. Personally, I wouldn’t consider it a high probability bottom until 245 is reclaim as support, turning weekly structure bullish. Looking at the daily, we are also pressing right up against the 200dMA which has capped price since 2022, with the pair deviating above it in January 2023 and then continuing the downtrend; bulls want to see that 200dMA turn support on a breakout -> retest from here…
And that concludes this week’s Market Outlook.
I hope you’ve found value in the read and thank you for supporting my work!
As ever, feel free to leave any comments or questions below, or email me directly at nik@altcointradershandbook.com.

