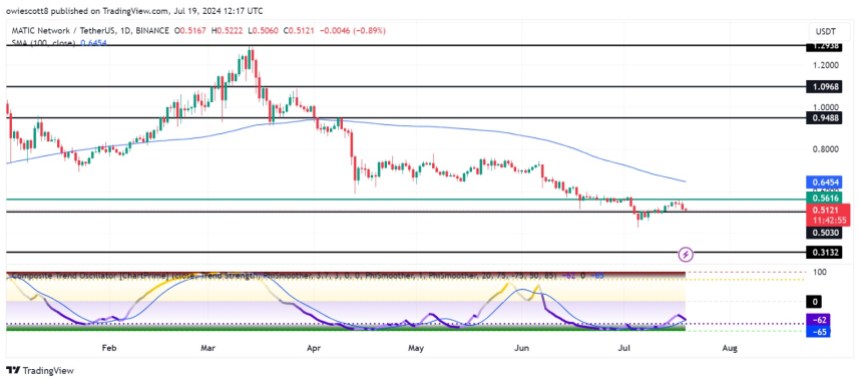
The recent trading activity has seen the MATIC price decline, targeting the $0.5030 mark after a period of strong upside momentum that was broken by bearish pressure. This sudden decline, which came as a result of growing bearish sentiment in the market, has sparked speculation among traders and investors as to whether the $0.5030 support level will hold or whether further declines are imminent.
As the bearish sentiment towards MATIC continues to grow, this article will analyze the current price action and technical indicators that suggest a continued downtrend. The goal is to provide readers with a comprehensive understanding of the potential future trajectory of MATIC.
MATIC was trading at around $0.511, and at the time of writing, the market cap was over $5 billion, the volume was over $250 million, and it was down 3.93%. The market cap and volume were down 3.88% and 20.31% respectively in the last 24 hours.
Market Overview: MATIC Recent Performance and Current Slides
On the 4-hour chart, MATIC is in an active downtrend and is currently moving below the 100-day simple moving average (SMA) towards the $0.5030 support level. It is worth noting that MATIC previously attempted a bullish correction but was stopped at $0.5673.
The 4-hour Composite Trend Oscillator shows that MATIC could continue its downtrend towards the $0.5030 level, as the signal line crossed down the SMA of the indicator and both lines are currently trying to move below the zero line.
On the 1-day chart, MATIC is trading below the 100-day SMA and has experienced a three-day uninterrupted downtrend towards the $0.5030 support level. If this downtrend continues, the digital asset could fall below $0.5030 and extend the downtrend.

Finally, the 1-day composite trend oscillator indicates that the MATIC price is likely to continue its current downtrend, as the signal line crosses the indicator’s SMA below and tries to move back into the overheated selling zone.
Future Outlook: Potential Scenarios for MATIC Price Movement
The current price action of MATIC suggests that the coin is on the verge of expanding its bearish movement, with $0.5030 being a key point to watch. If the price reaches this level and breaks below it, it could fall to the $0.3132 support range. If this level is broken, the crypto asset could see its price drop further to other lower levels.
However, if MATIC is rejected at the $0.5030 level, it may start to rise again towards the $0.9488 resistance level. If the $0.9488 resistance is broken, it may experience further price gains to challenge the $1.096 mark and other higher levels.

