Crypto Flexs
  • DIRECTORY
  • CRYPTO
    • ETHEREUM
    • BITCOIN
    • ALTCOIN
  • BLOCKCHAIN
  • EXCHANGE
  • TRADING
  • SUBMIT
Crypto Flexs
  • DIRECTORY
  • CRYPTO
    • ETHEREUM
    • BITCOIN
    • ALTCOIN
  • BLOCKCHAIN
  • EXCHANGE
  • TRADING
  • SUBMIT
Crypto Flexs
Home»ALTCOIN NEWS»MOVE Cryptocurrency Rally Analysis – Will Profit-seekers Precipitate a Reversal?
ALTCOIN NEWS

MOVE Cryptocurrency Rally Analysis – Will Profit-seekers Precipitate a Reversal?

By Crypto FlexsDecember 21, 20243 Mins Read
Facebook Twitter Pinterest LinkedIn Tumblr Email
MOVE Cryptocurrency Rally Analysis – Will Profit-seekers Precipitate a Reversal?
Share
Facebook Twitter LinkedIn Pinterest Email
  • The MOVE cryptocurrency is up more than 12% in 24 hours after a surge in buying pressure.
  • A falling RSI on the hourly chart indicates that traders who buy during the rally may take profits.

Movement (MOVE) outperformed the rest of the overall market after posting a gain of over 12% in 24 hours. At press time, MOVE was trading at $0.797 with a 137% surge in trading volume. CoinMarketCap.

MOVE’s upward trend has seen its market capitalization surge past $1.79 billion, with the altcoin now ranking as the 61st largest cryptocurrency by this metric.

One of the factors that triggered MOVE’s rally was a surge in buying activity as short-term traders looked to profit during the rally. However, buying volume appears to have subsided during lower hours, which could trigger a decline if sales pick up.

The Relative Strength Index (RSI) has fallen to 41 at press time, close to oversold territory. This could be ahead of a short-term upward correction, but it could also suggest that traders who bought during the uptrend are starting to sell.
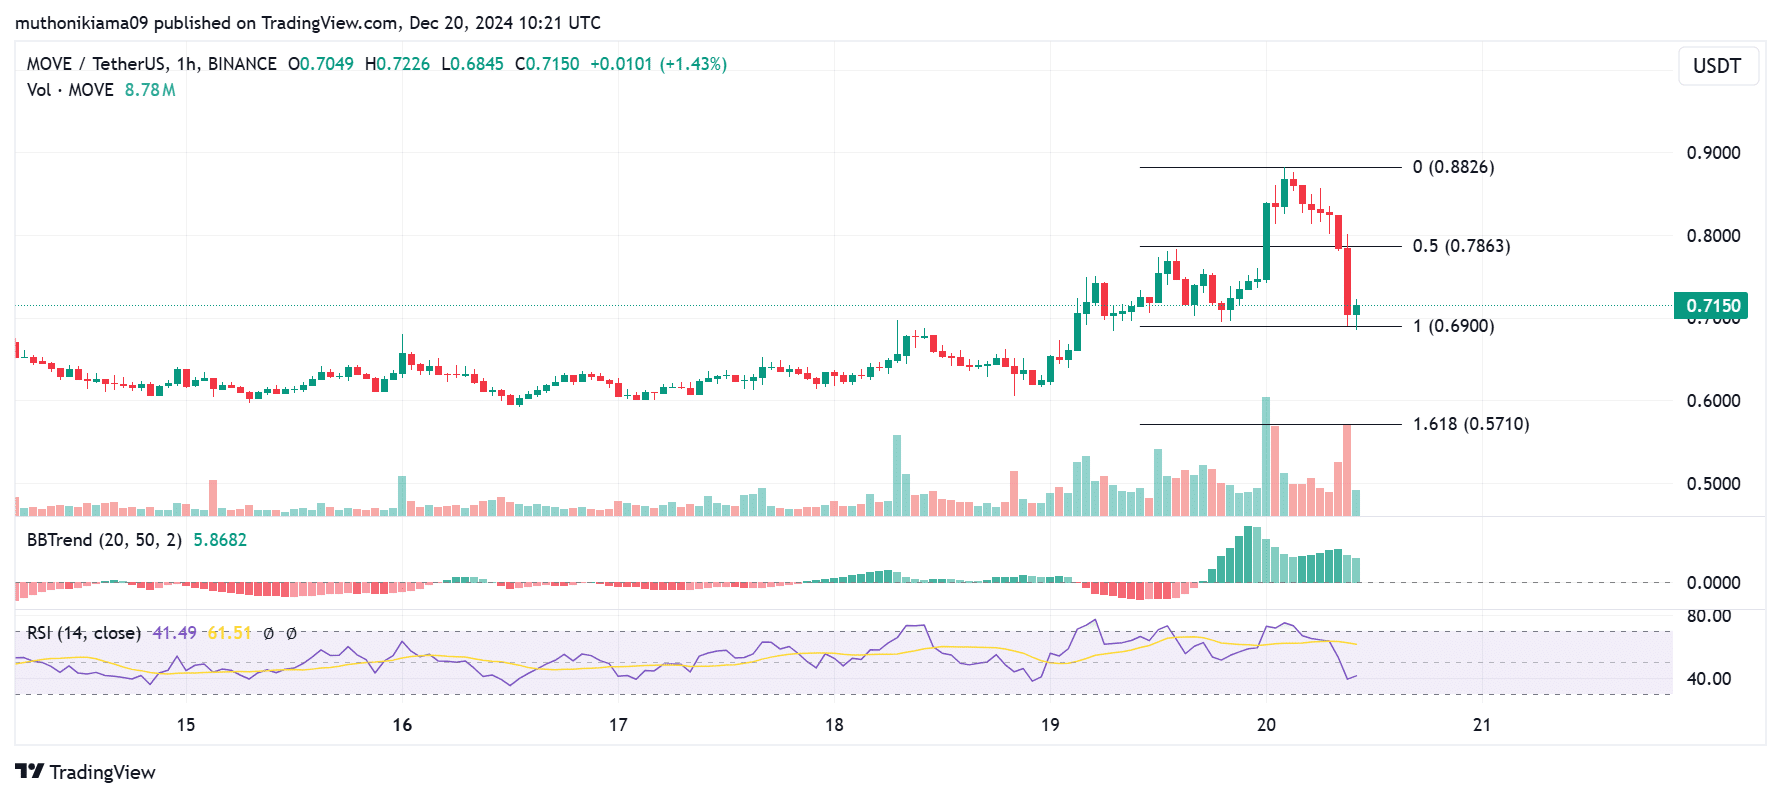
Source: TradingView

The green Bollinger Bands trend indicator shows that the bulls have the upper hand despite a surge in selling activity. If buyers re-enter the market, the price may return to the key resistance level of $0.882.

On the other hand, if the bearish trend continues and buyers fail to intervene, MOVE could fall to the important support level of 1.618 Fibonacci level ($0.57).

Derivatives data analysis

Looking at derivatives market data for the MOVE cryptocurrency, we see a significant surge in speculative activity that can cause volatility.

The token’s open interest rose to $86 million after rising slightly by 1.6% in 24 hours. At the same time, trading volume in the derivatives market increased 96% to $2.35 billion.

Volatile price movements led to a surge in liquidations of both long and short positions, with more than $8 million liquidated in 24 hours.
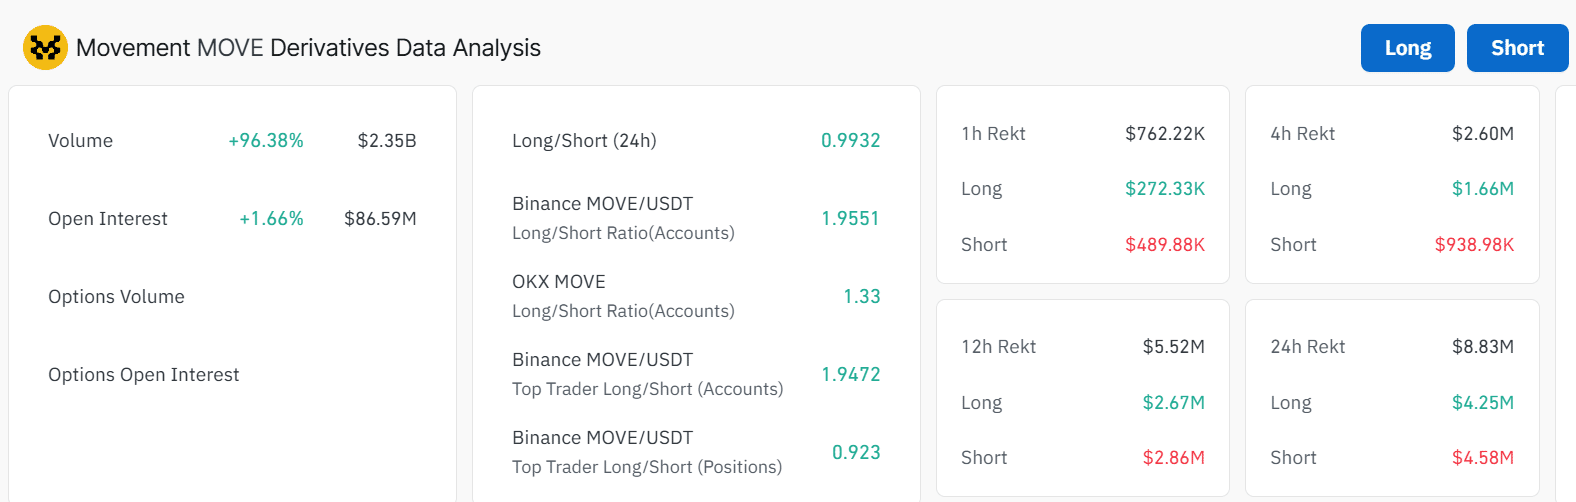
Source: Coinglass

The long/short ratio of 0.99 shows neutral market sentiment with slightly more short positions. However, in these balanced markets, the risk of a short or long squeeze is reduced, which reduces volatility.

MOVE’s liquidation heatmap shows:

The liquidation heatmap for the MOVE cryptocurrency with a 3-day conversion confirmation period shows that the upward trend has resulted in a series of short-term liquidations. As these positions were wiped out, the upward trend accelerated through forced purchases.
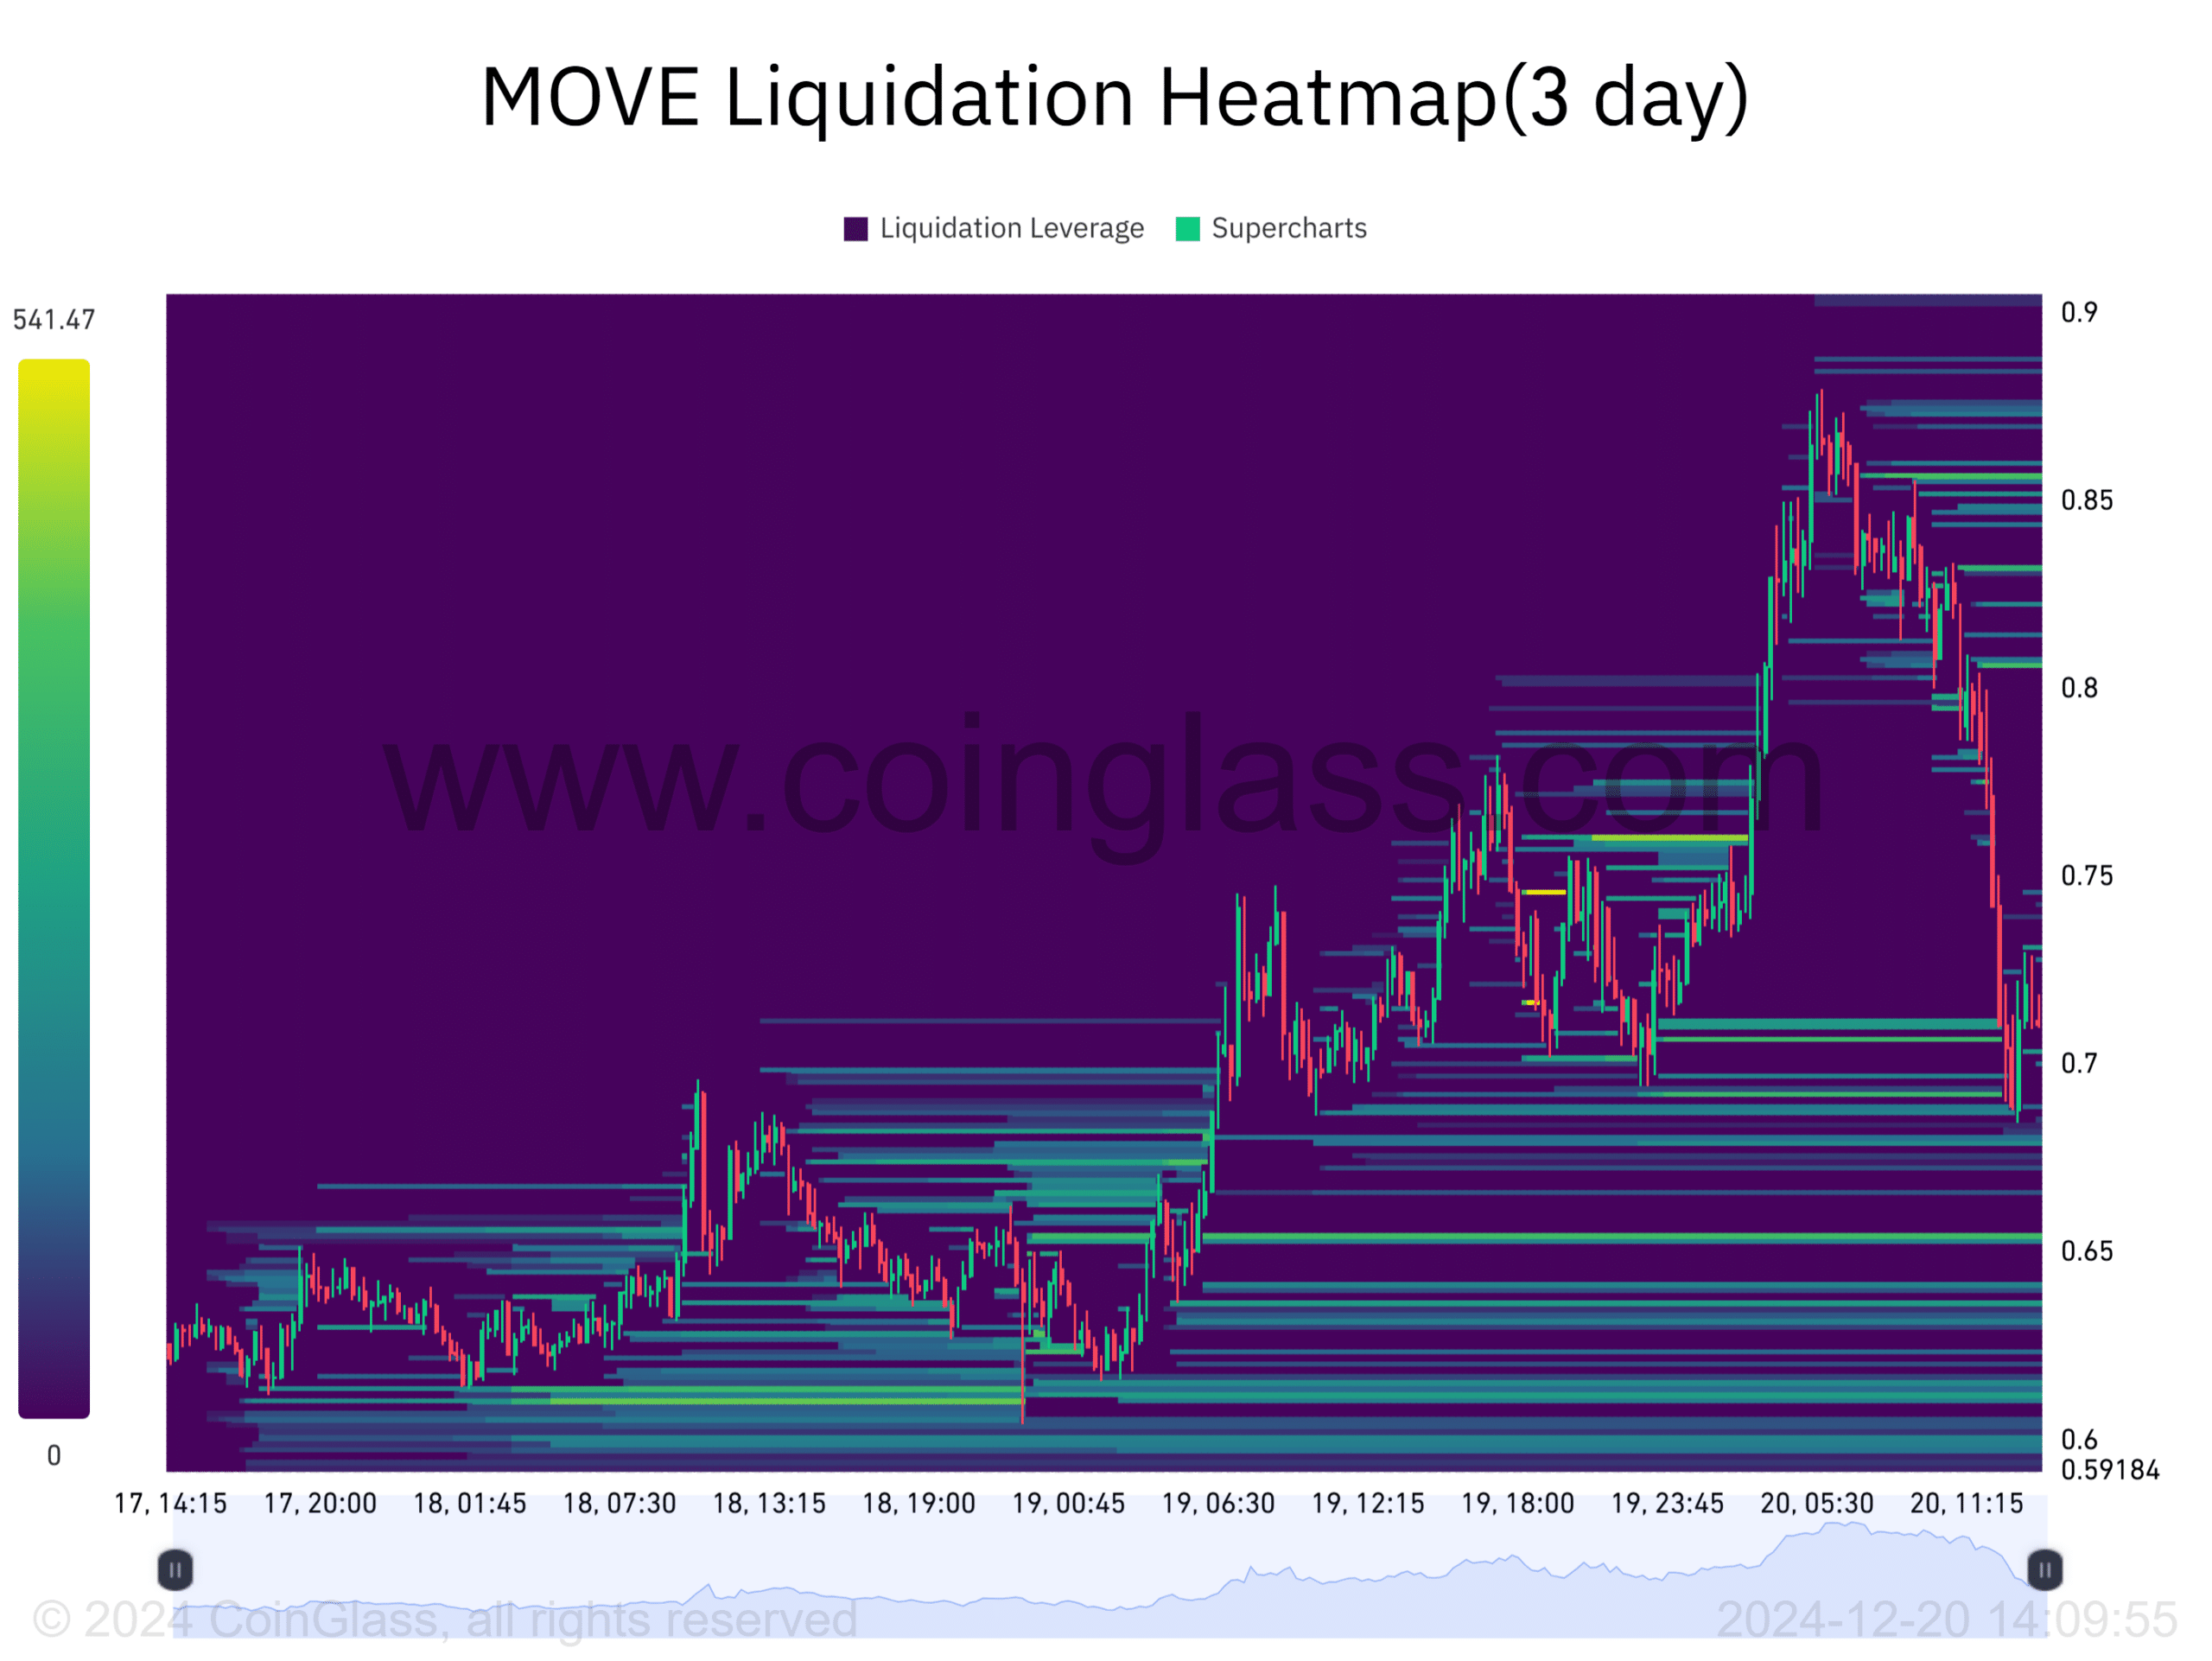
Source: Coinglass


Is your portfolio green? Check out our Moving Profit Calculator


On the other hand, there is a liquidation cluster below the price that could push MOVE lower. Two areas that traders should watch out for are $0.65 and $0.67.

If MOVE falls to this level, long positions may be closed and selling activity may accelerate, accelerating the downtrend.

Next: Will Cryptocurrencies Recover? You can see exactly why this ‘drop’ is what the market needs.

Share. Facebook Twitter Pinterest LinkedIn Tumblr Email

Related Posts

Tiny Bermuda chooses Stellar for its entire financial operations.

May 14, 2026

What the trading platform actually looks like

May 7, 2026

Crypto billionaire Justin Sun files suit against Trump-linked World Liberty Financial over ‘wrongly’ frozen tokens

April 30, 2026
Add A Comment

Comments are closed.

Recent Posts

Sui Launches Gasless Stablecoin Transfers With Support From Fireblocks

May 20, 2026

Bitcoin Ally Kevin Warsh’s Polymarket Odds Jump to 94%

May 20, 2026

AI Astrology And The Future Of Personalized Digital Ecosystems

May 20, 2026

Bitcoin price falls below $77,000 and ETF sales exceed $1 billion.

May 19, 2026

Videos and Podcasts | Vault 12

May 19, 2026

Swan Bitcoin faces nearly $1 billion lawsuit related to Prime Trust transfers

May 19, 2026

$100/Month In Bitcoin Since 2015 Would Have Turned $13,700 Into $632,000, Coinbird Analysis Shows

May 19, 2026

MEXC Reports Sharp Surge In TradFi Futures Trading Volume In April, Led By 1,600% Jump In INTC

May 19, 2026

Urban Run” Game With Up To 1 BTC In Rewards

May 19, 2026

Bitmine Immersion Technologies (BMNR) Announces ETH Holdings Reach 5.28 Million Tokens, And Total Crypto And Total Cash Holdings Of $12.6 Billion

May 18, 2026

How to Bet Safely with Crypto: The Most Trusted Licensed Sportsbook

May 18, 2026

Crypto Flexs is a Professional Cryptocurrency News Platform. Here we will provide you only interesting content, which you will like very much. We’re dedicated to providing you the best of Cryptocurrency. We hope you enjoy our Cryptocurrency News as much as we enjoy offering them to you.

Contact Us : Partner(@)Cryptoflexs.com

Top Insights

Sui Launches Gasless Stablecoin Transfers With Support From Fireblocks

May 20, 2026

Bitcoin Ally Kevin Warsh’s Polymarket Odds Jump to 94%

May 20, 2026

AI Astrology And The Future Of Personalized Digital Ecosystems

May 20, 2026
Most Popular

Crypto analysts predict a 28,900% rise in the XRP price to $154. The timings are as follows:

May 28, 2024

Beneficiary Recruitment: December 2021 | Ethereum Foundation Blog

December 29, 2023

Bitcoin (BTC) price could fall to $40,000. ADA, ALGO, SOL lead cryptocurrency profits

December 9, 2023
  • Home
  • About Us
  • Contact Us
  • Disclaimer
  • Privacy Policy
  • Terms and Conditions
© 2026 Crypto Flexs

Type above and press Enter to search. Press Esc to cancel.