
 Price: Recovery or Short-Term Relief?")
index
Polkadot (DOT) price has been in a downward trend for quite some time. However, during this period it has found strong and consistent support at $6.40, indicating that the price may have bottomed.
DOT saw significant gains on Wednesday and Thursday, pushing the price above the 20-day SMA and 200-day SMA.
Polkadot (DOT) bounces off support level
Since hitting yearly highs on March 14, DOT has fallen more than 40% and has come some way off those highs. DOT then fell from $11.55 to $8.77 by March 19, falling below its 20-day SMA. The recovery pushed DOT up to $9.14, but thanks to the 20-day SMA, the price fell to $8.43 by April 3. After a brief recovery, DOT fell significantly on April 12 and 13, falling 13.48% and 11.72%, respectively. This pushed the price below the 200-day SMA to $6.40.
This was where DOT found strong support and allowed the price to rebound. DOT rose above the 200-day SMA on April 22 to $7.47. However, at this point the 20-day SMA acted as resistance and DOT fell below the 200-day SMA to $6.73 by Sunday. DOT continued to be in the red this week, falling 2.23% on Monday and 2.43% on Tuesday, ending the session at $6.42. As mentioned earlier, this is a very strong support level and DOT bounced back on Wednesday, up 7.48% to $6.80 and testing resistance at $7. Buyers on Thursday continued to push the DOT higher, pushing the price up 5.65% to settle above the 20-day SMA and 200-day SMA at $7.29.
DOT is currently trading at $7.17, just above its 200-day SMA, as buyers and sellers try to control the session.
Does the Double Bottom Pattern Signal a Revival?
Looking at the Polkadot (DOT) price chart, we can discover some interesting facts. The DOT price chart shows a descending triangle between March 15th and April 11th, indicating that sellers are in control. DOT created a double bottom pattern on April 30, indicating that the price bottomed out. So where does DOT go from here? DOT is currently trading between $7.10 and $7.20, with its 200-day SMA currently trading at $7.19. If DOT is unable to stay above the 200-day SMA, DOT may fall to $7, with the 20-day SMA acting as support. If sellers violate this level, DOT could fall back to the support level of $6.40.
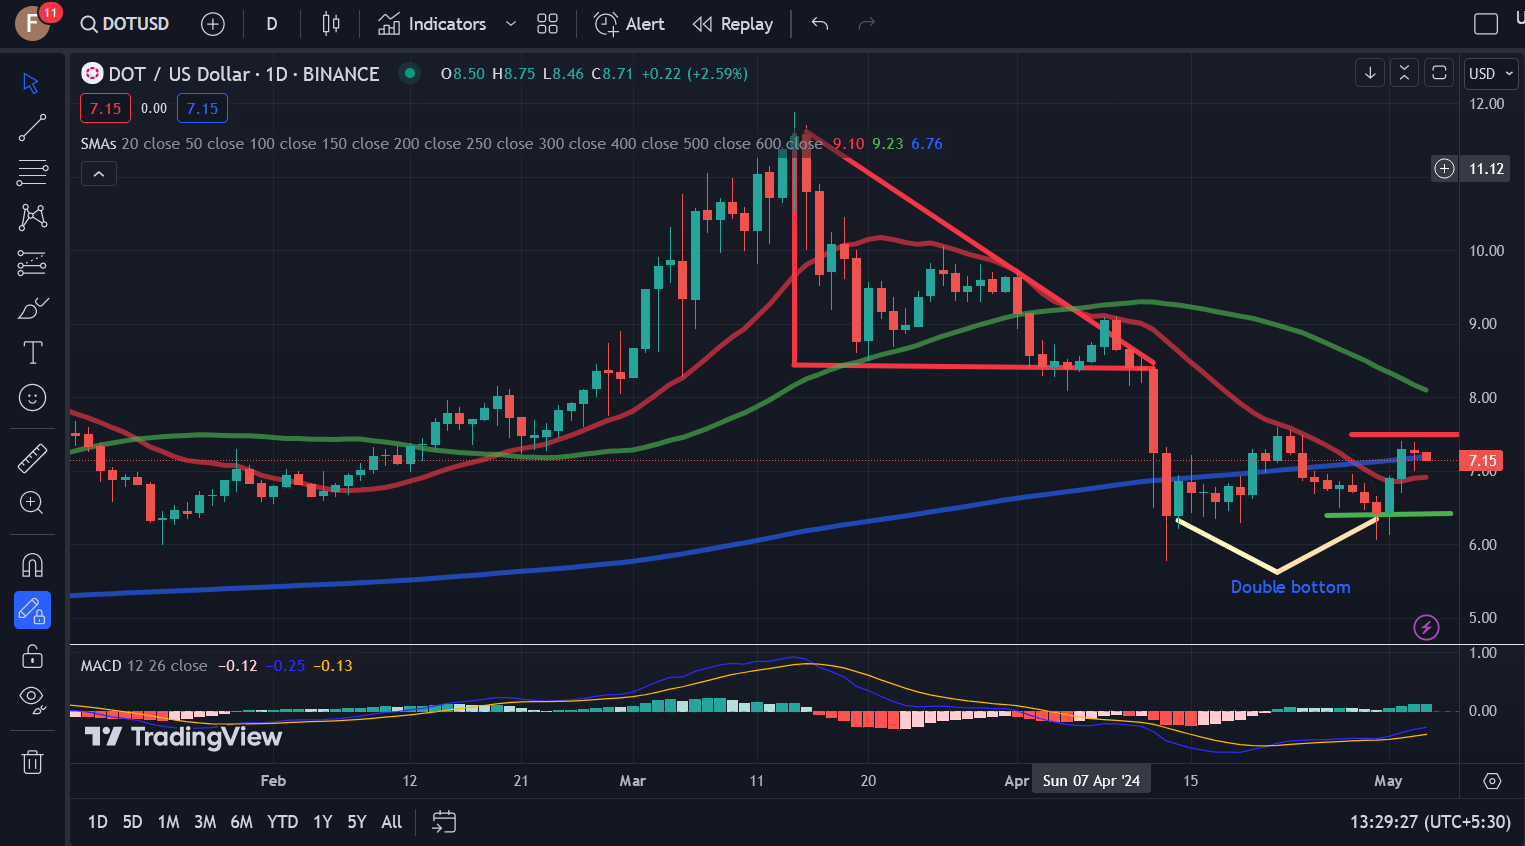
Price appreciation will depend on DOT’s ability to hold positions above the 200-day SMA. If this happens, DOT could test the $8 price level where the 50-day SMA could act as a strong resistance level.
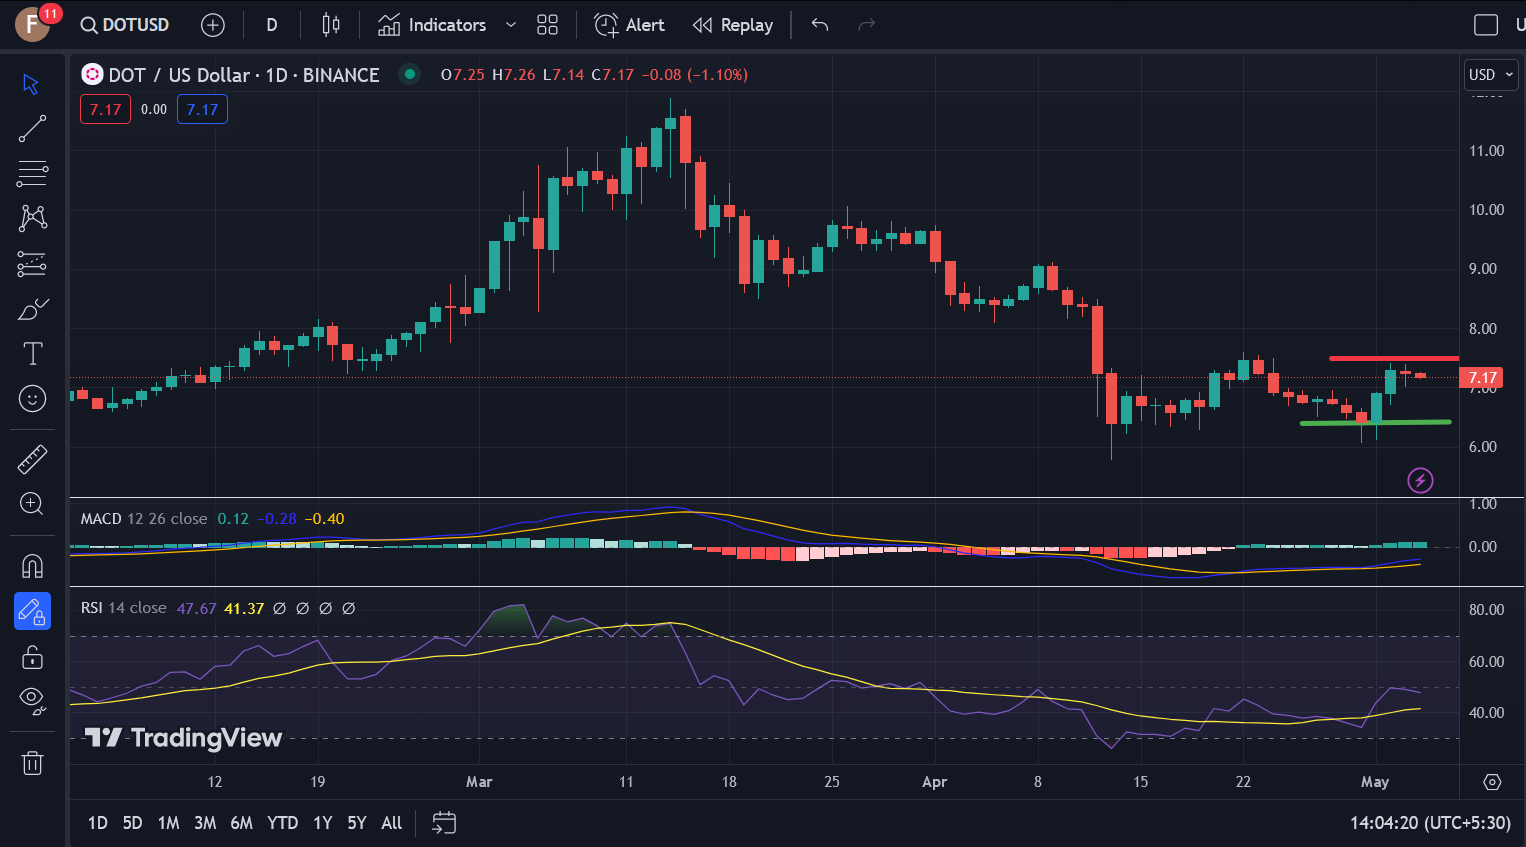
What the indicators say
Looking at the indicator, the MACD is currently bullish, indicating bullish sentiment and supporting the possibility of a long-term price rebound. RSI is currently firmly in neutral territory, which indicates that DOT has room for further price increases.
Additionally, the recent DOT price drop has resulted in the liquidation of a large number of long positions, resulting in a significant drop in the OI weighted funding ratio. The falling funding rate and DOT’s price consolidation support means that the price may have bottomed and we could see the value of DOT rise.

Disclaimer: This article is provided for informational purposes only. It is not provided or intended to be used as legal, tax, investment, financial or other advice.
Investment Disclaimer