- Simon’s Cat (CAT) entered the price discovery phase and recorded an ATH on September 21.
- Key technical indicators suggest a near-term recession is possible.
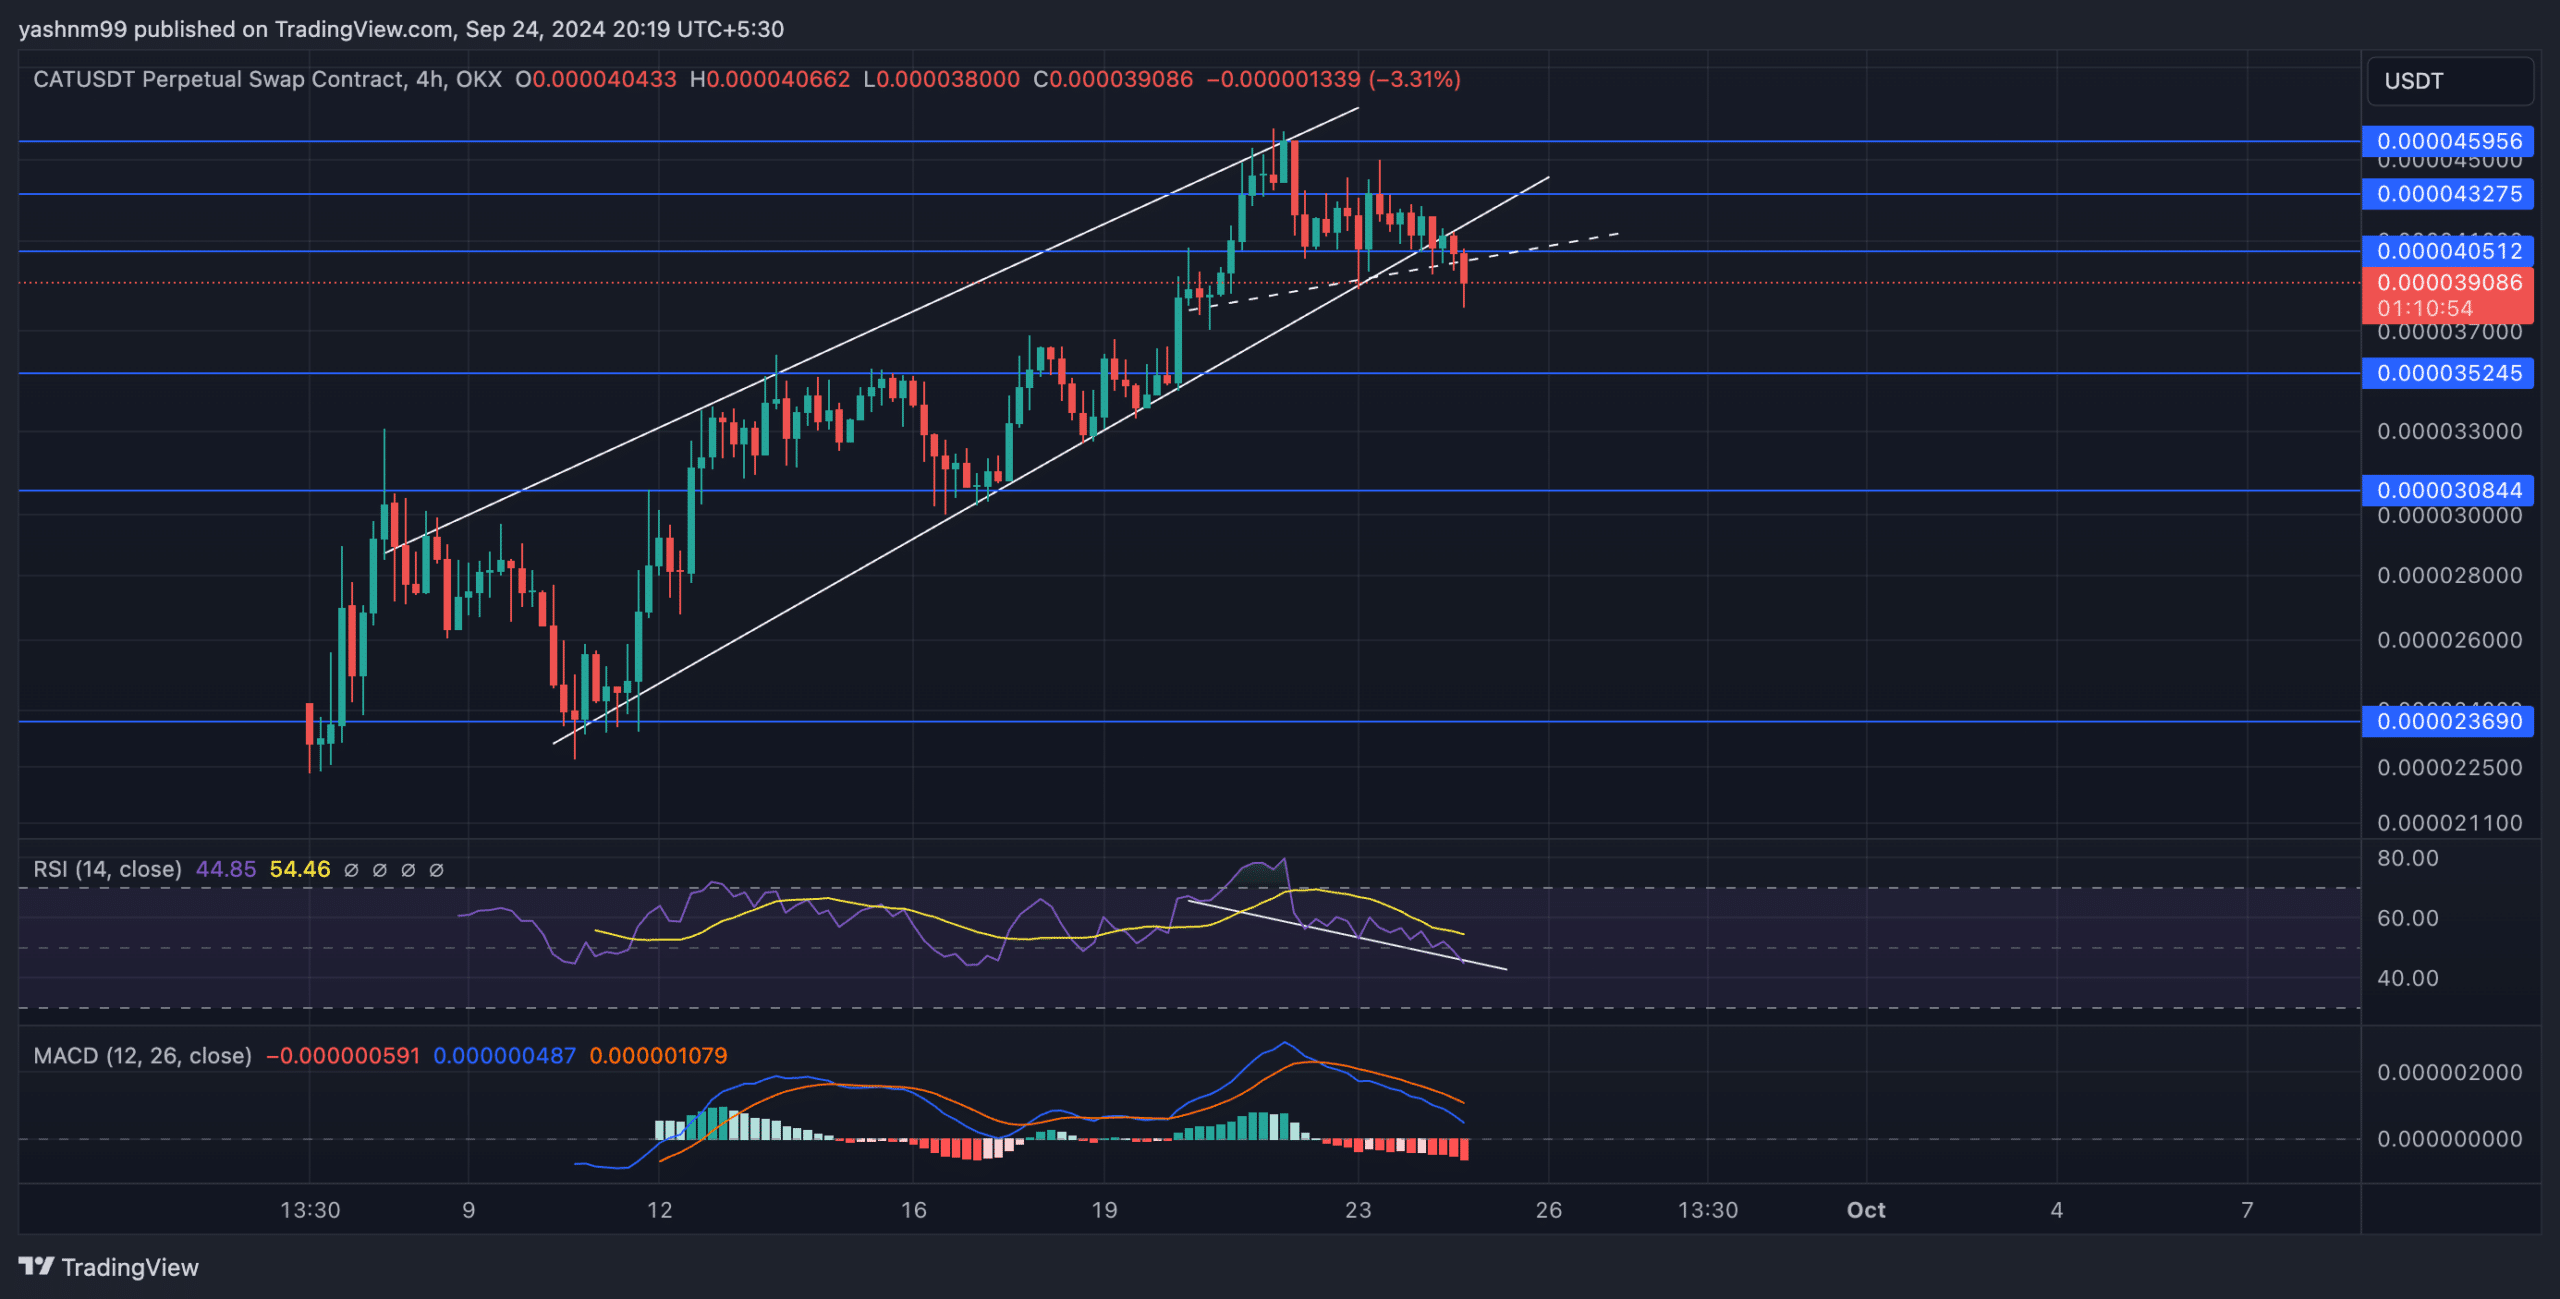
Simon’s Cat (CAT) recently entered price discovery mode, hitting a new ATH of $0.0000464 on September 21. The meme coin saw an exponential rally but slowed down after breaking out of a short-term rising wedge structure.
At the time of writing, CAT was trading at $0.0000391, down about 6.5% in the last 24 hours after witnessing a bearish breakout.
Simon’s Cat Price Prediction: Can RSI Fuel a Short-Term Rally?
Like most meme coins, CAT experienced a rally immediately after its launch amidst huge investor excitement. This excitement caused the meme coin to double in value in just two weeks.
Despite the recent downturn, CAT’s RSI (Relative Strength Index) is showing early signs of a bullish divergence. Prices are reaching higher highs while the RSI is reaching lower lows.
These divergences are often a signal of a possible reversal in momentum, which could provide buyers with a short-term rally before another downtrend.
If the bullish divergence is realized, CAT could bounce towards the $0.000041 resistance level and potentially reach the ATH level in the coming sessions.

Source: TradingView, CAT/USDT
On the other hand, the recent rising wedge breakout increases the likelihood of a further pullback. If selling pressure continues, CAT could find support at $0.0000352 and $0.0000308 before attempting a rebound.
The RSI is hovering around 45 and well below the moving average, indicating that the momentum is currently shifting towards the sellers.
The MACD indicator (Moving Average Convergence Divergence) has shown a bearish crossover, with the MACD line falling below the signal line. This crossover usually signals the beginning of a short-term downtrend. If these lines fall below the zero level, we will see a stronger downtrend.
The road ahead
Simon’s Cat (CAT) is in a critical phase after recording a new ATH and then breaking out of a rising wedge breakout. The bullish divergence in the RSI suggests a potential short-term rally, but traders should be cautious as technical indicators such as the MACD confirm weakening momentum.
A break above $0.0000405 could revive bullish sentiment and push the price higher to $0.0000464, while a continued downtrend could see support levels tested at $0.0000352 and $0.0000308.
Traders should carefully monitor these key levels and overall market sentiment to capitalize on CAT’s next move.

