

- Stellar Lumens’ downtrend headed towards key support levels at $0.3 and $0.36.
- An upward liquidity sweep could influence the price to rebound towards $0.50.
Stellar Lumens (XLM) It was up 45% in early January but has erased some of the gains. The recent market sell-off may present another buying opportunity for swing traders and investors.
After surging from $0.30 to nearly 50 cents, XLM’s continued decline was heading toward a key level that could re-engage bulls’ attention.
Stellar Lumens Price Prediction
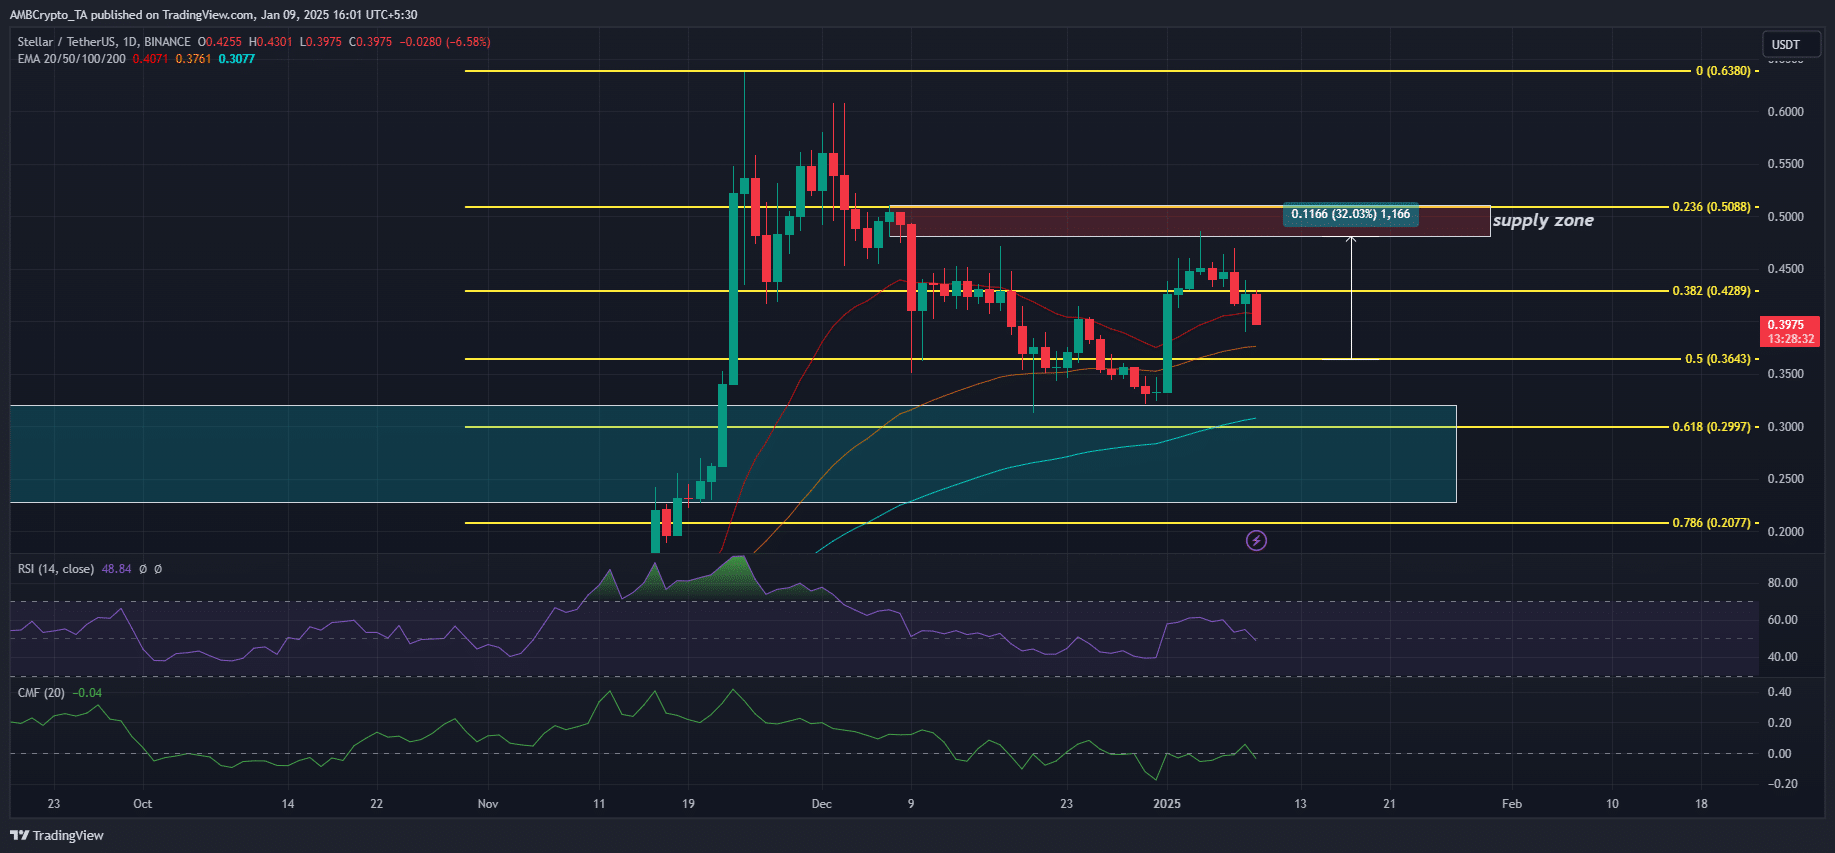
Source: XLM/USDT, TradingView
First, the New Year’s upward trend reversed the daily chart market structure to a strong one. This could change if the retracement extends below the recent low of $0.32.
The current outlook was poised to be bullish until a change occurred in the bearish market structure.
The recent decline was about 18% and closed at the key level of $0.36, with December support stopping the holiday sell-off at $0.30.
Both levels could be a re-entry into the market by bulls targeting indirect supply below $0.50 (red zone). If XLM extends its decline below $0.30, any bullish ideas will be invalidated.
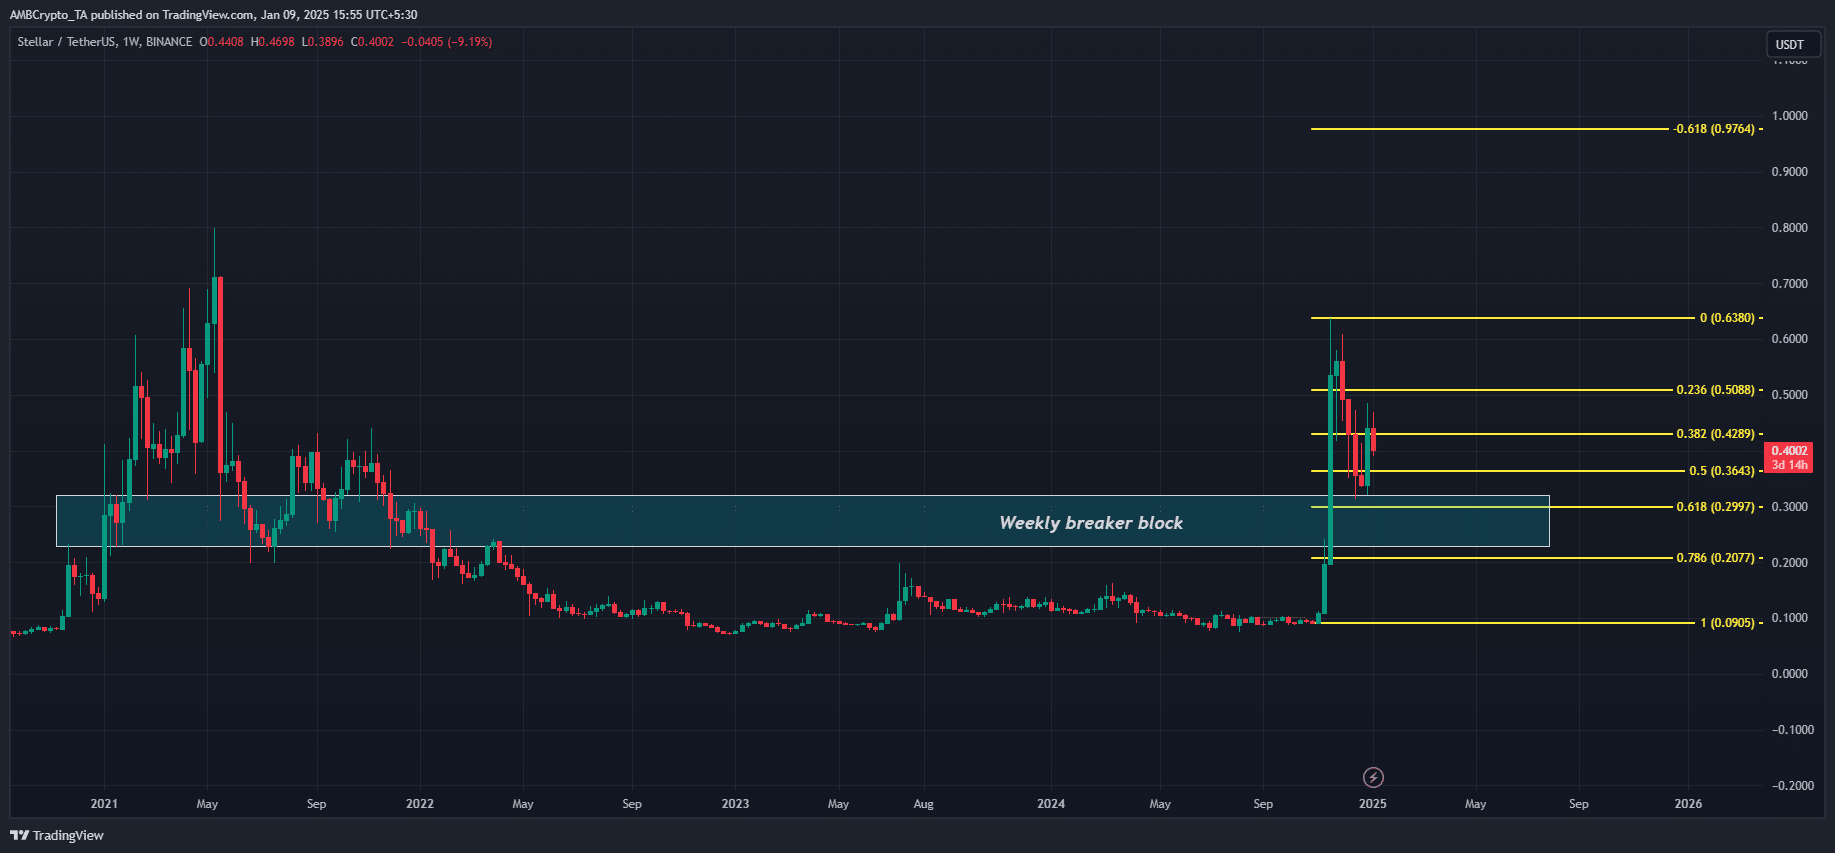
Source: XLM/USDT, TradingView
The $0.30 support was further strengthened by the weekly chart, which marked the turquoise area as a blocking block that, if defended, could trigger a price rebound.
Rising Liquidity Could Attract XLM Price
There were two rising liquidity levels worth tracking from a liquidity sweep perspective. The first price was between $0.43 and $0.45, and the second price was $0.48.
In most cases, these high liquidity zones always act as magnets for price action.
If so, they could be the next major upside target for a possible XLM rebound. Interestingly, the upper liquidity zone coincided with the supply zone below $0.50 on the price chart.
This means you can record a partial profit on the first target and liquidate the remainder when the price reaches the $0.48-$0.50 target.
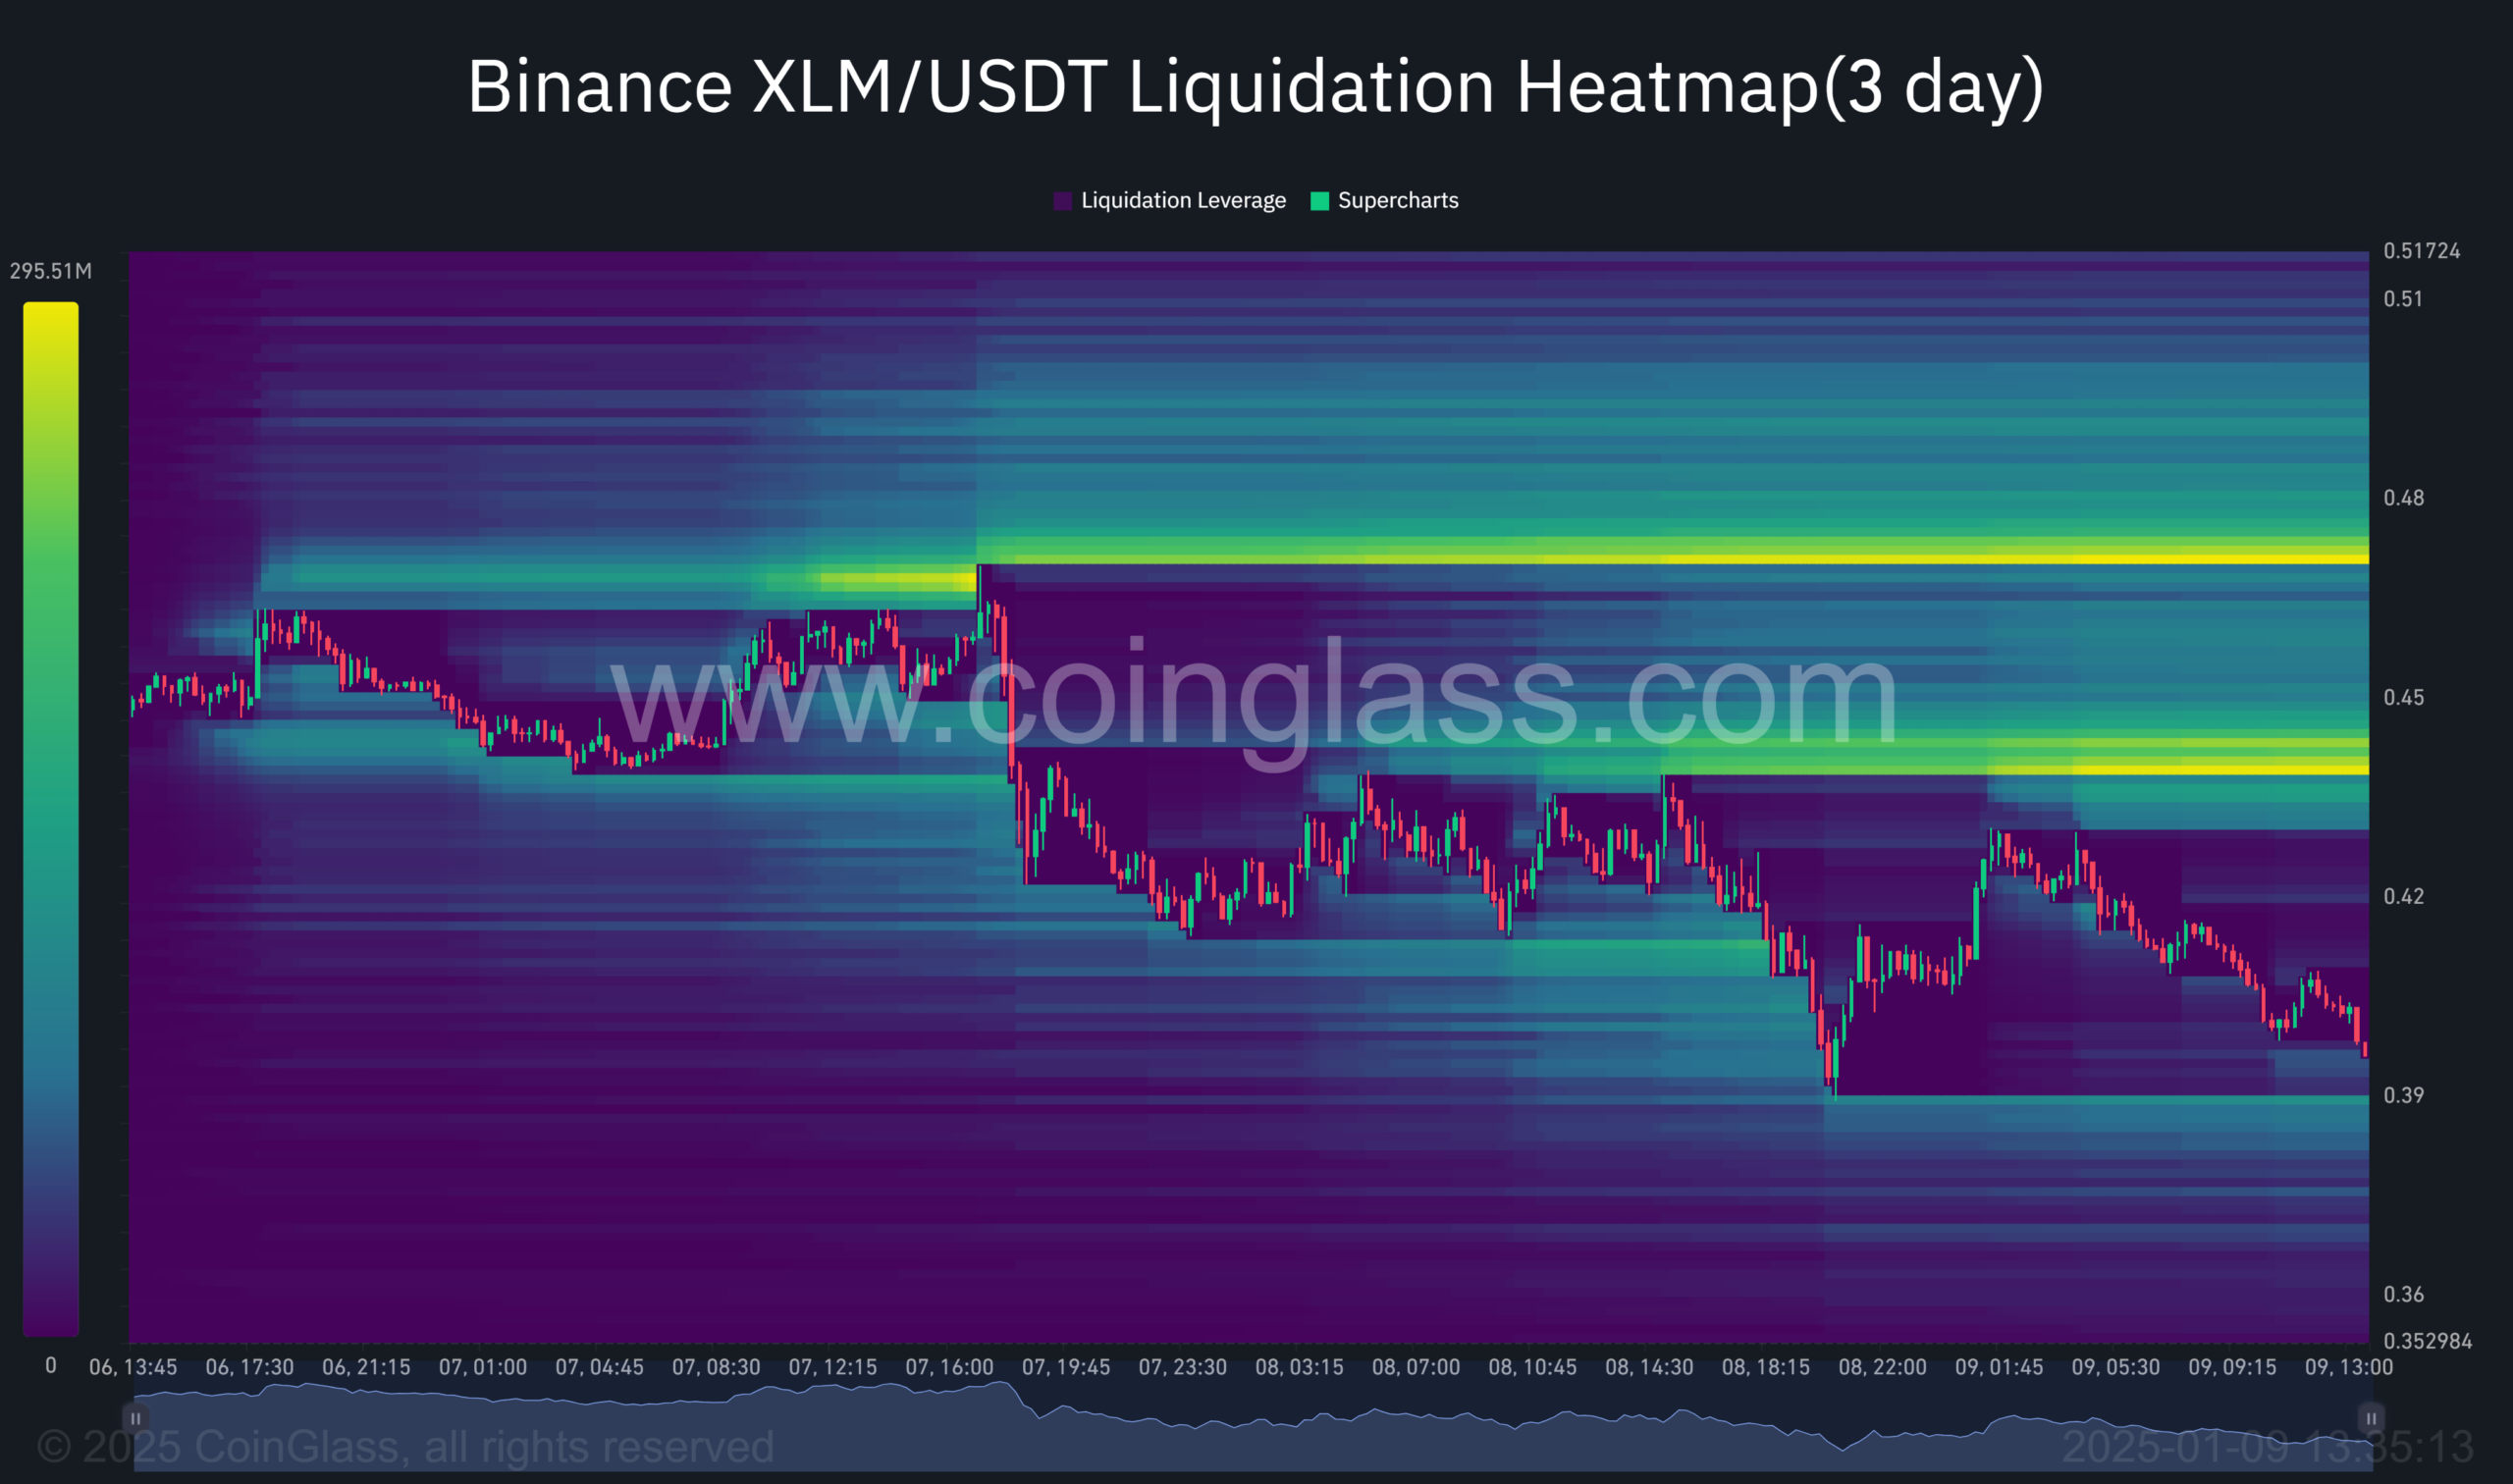
Source: Coinglass
read Stellar Lumens (XLM) Price Prediction From 2025 to 2026
In conclusion, XLM’s market structure and liquidation heatmap suggest a good buying opportunity if the decline extends to $0.30.
However, continued selling below $0.30 will embolden sellers and invalidate the bullish argument.
Disclaimer: The information presented does not constitute financial, investment, trading, or any other type of advice and is solely the opinion of the author.