Crypto Flexs
  • DIRECTORY
  • CRYPTO
    • ETHEREUM
    • BITCOIN
    • ALTCOIN
  • BLOCKCHAIN
  • EXCHANGE
  • TRADING
  • SUBMIT
Crypto Flexs
  • DIRECTORY
  • CRYPTO
    • ETHEREUM
    • BITCOIN
    • ALTCOIN
  • BLOCKCHAIN
  • EXCHANGE
  • TRADING
  • SUBMIT
Crypto Flexs
Home»ALTCOIN NEWS»Stellar (XLM) Flips SUI After 11% Surge – Mapping Next Price Target
ALTCOIN NEWS

Stellar (XLM) Flips SUI After 11% Surge – Mapping Next Price Target

By Crypto FlexsJanuary 16, 20253 Mins Read
Facebook Twitter Pinterest LinkedIn Tumblr Email
Stellar (XLM) Flips SUI After 11% Surge – Mapping Next Price Target
Share
Facebook Twitter LinkedIn Pinterest Email
  • Stellar reversed SUI by market cap after rising more than 11% in 24 hours.
  • XLM’s rally can be attributed to buying pressure, with RSI moving closer to overbought territory.

Stellar (XLM) turned over SUI Based on market capitalization, after rising more than 11% in 24 hours. At press time, XLM, which currently ranks as the 12th largest cryptocurrency with a market capitalization of $14.21 billion, was trading at a weekly high of $0.467.

XLM may be poised for further gains due to the bullish outlook on the lower period chart. This is a sign that we could hit a multi-week high of $0.52 in the near term.

XLM Eyes Get More Gains

Stellar formed a double bottom pattern on the 4-hour chart, suggesting that a continuation of the bull run is imminent. In fact, the critical resistance at the neckline of this pattern also flipped, indicating that the uptrend looked strong.

Now the next target for price is the 1.618 Fibonacci extension level ($0.52). This uptrend will see XLM hit monthly highs.

The volume histogram bars show that buyers are behind this surge after purchase volume reached $154 million. This was also confirmed after the relative strength index (RSI) rose to 71. This is a sign that XLM may be approaching overbought.

(Source: Trading View)

The moving average convergence divergence (MACD) indicator also highlighted the bullish momentum. At the time of writing, the MACD line is positive and sloping northward, highlighting that the bulls are in control.

Long-Term Traders Could Derail XLM’s Rally

Stellar’s recent gains resulted in a loss of over $1.5 million in short positions. Liquidations appear to have stimulated demand for long positions after the funding rate reversed positively, according to Coinglass. This outlook shows that long traders are now willing to pay fees to hold their positions.

XLM’s liquidation heatmap with a 24-hour viewing period highlighted these short liquidations as the price rose. However, there is a cluster of liquidation levels below the price that can act as magnet zones and push XLM lower.
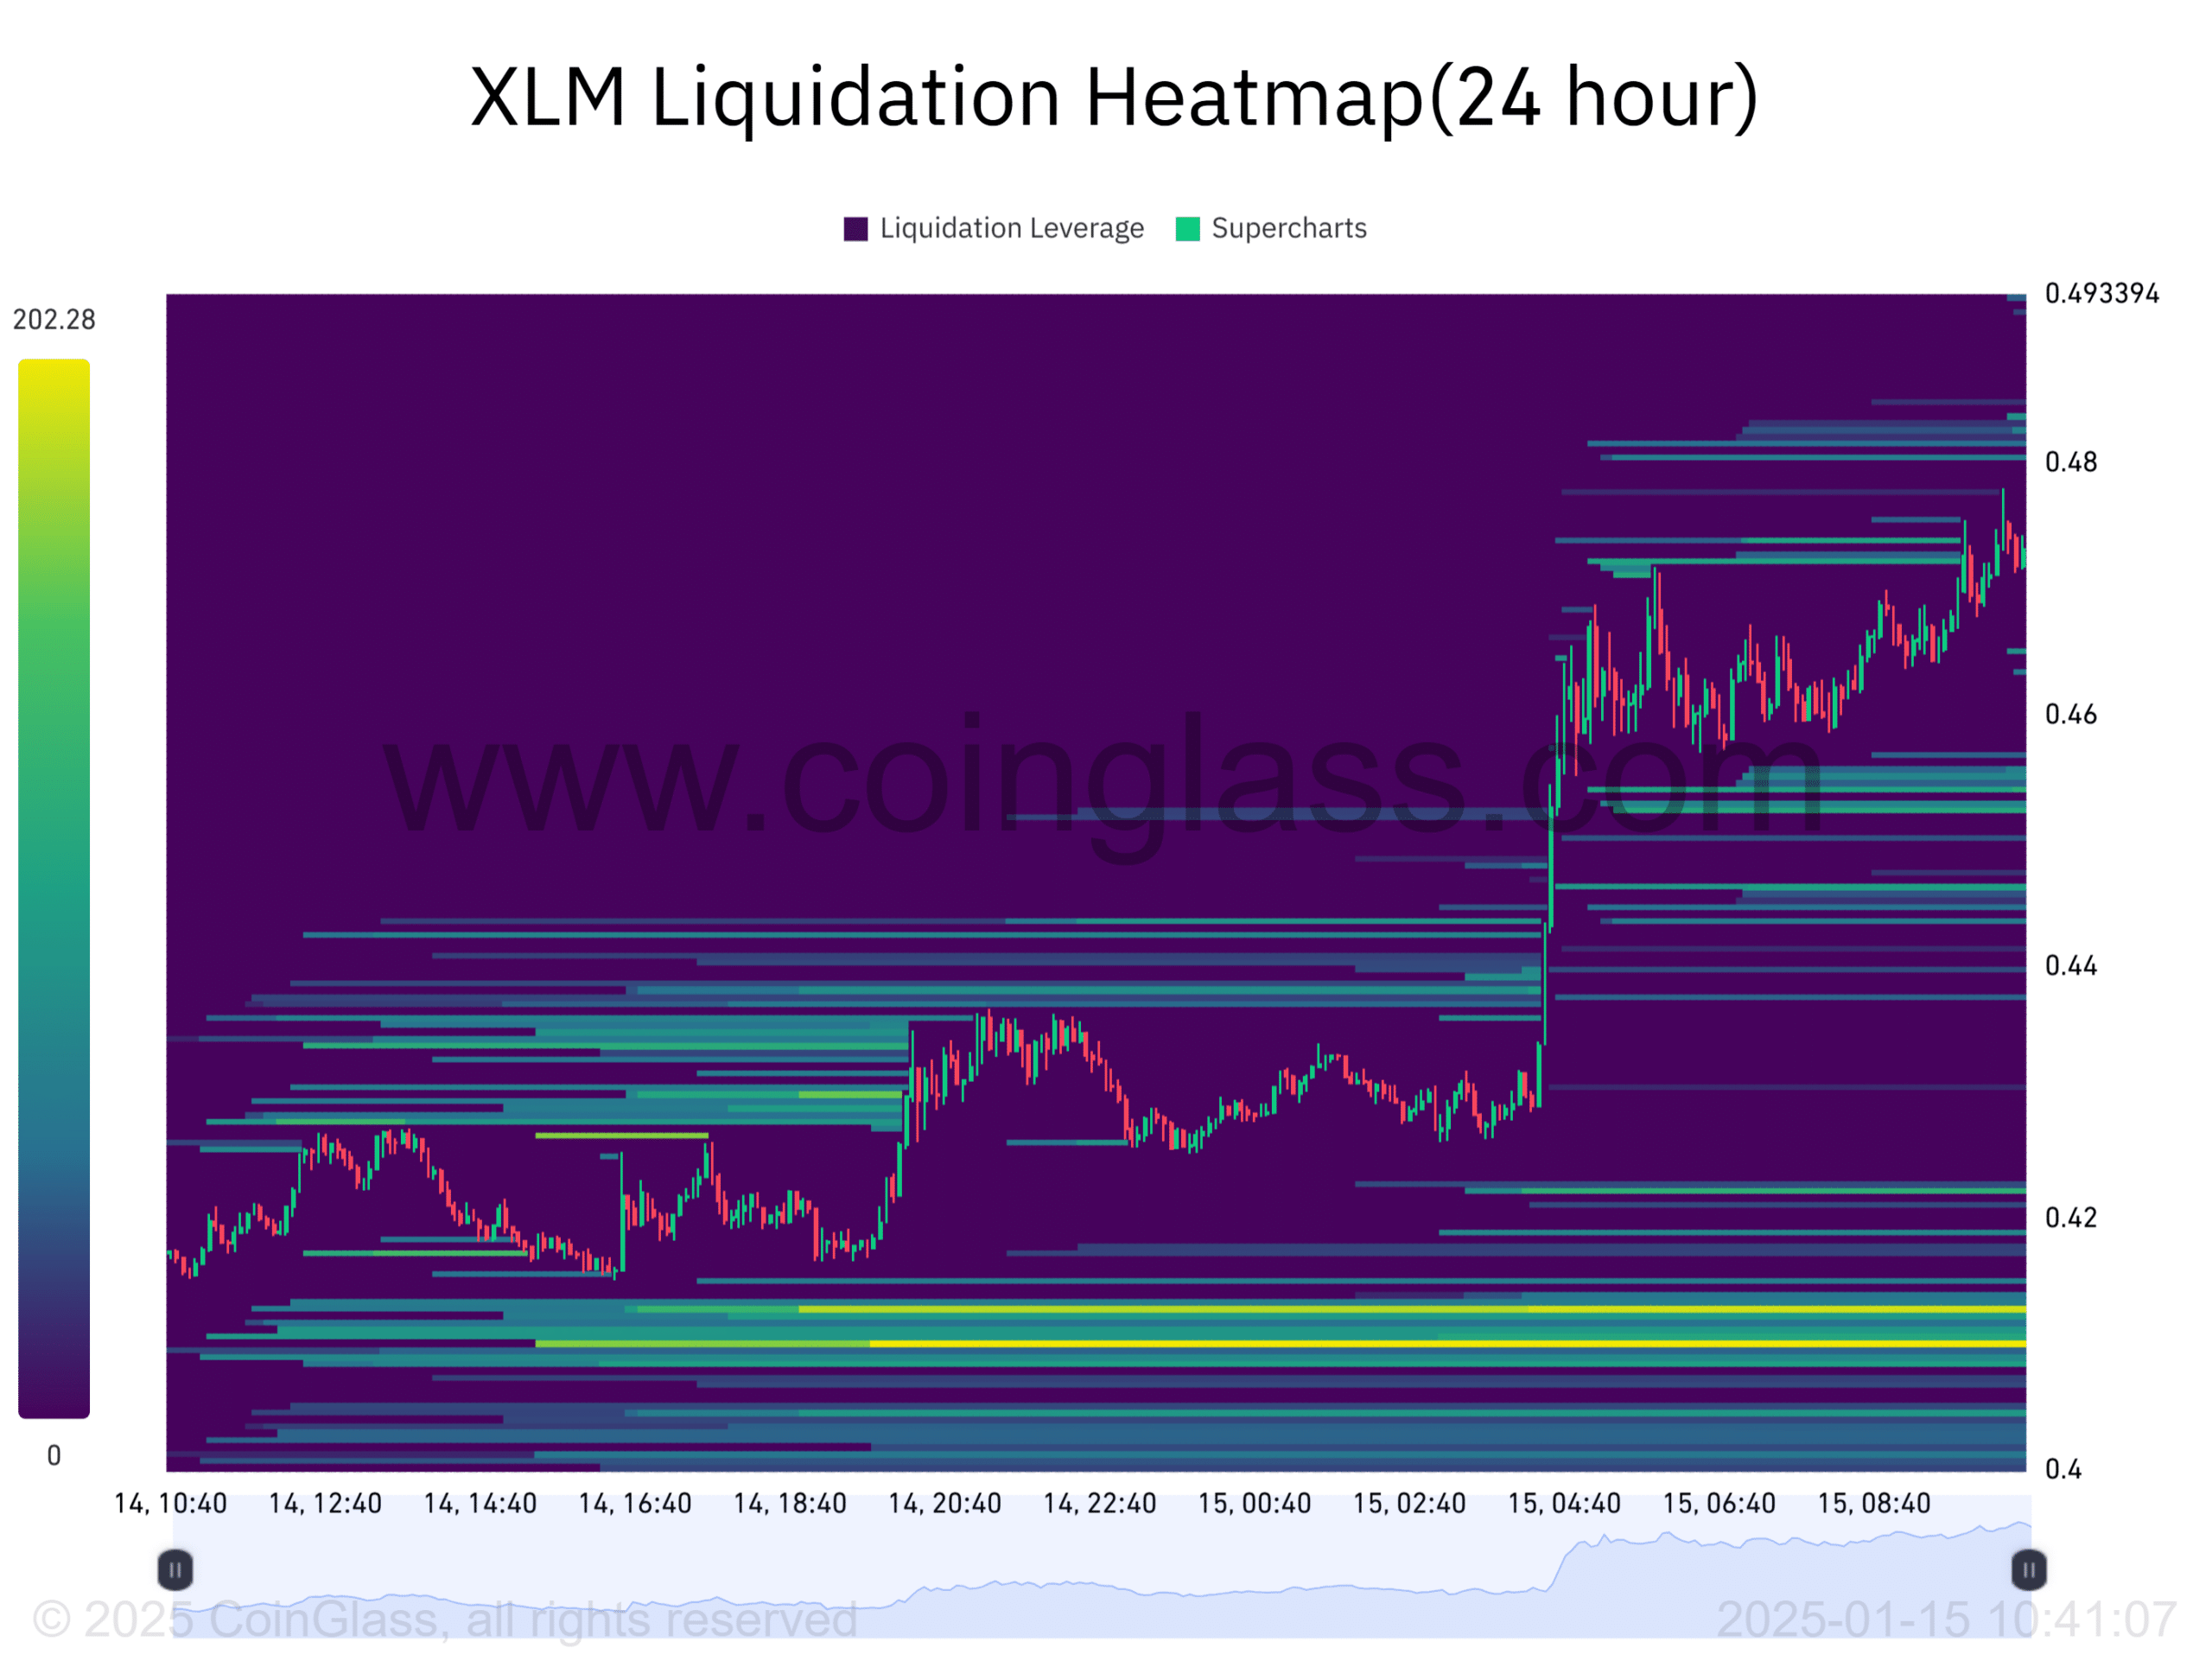
(Source: Coinglass)

The main clearing zone to watch is $0.40 – $0.41. Many long traders are at risk of being liquidated at this price level. An unexpected decline can trigger a sharp downturn as traders begin to liquidate their positions.

Can XLM emerge as a top 10 cryptocurrency?

After a recent surge in market capitalization, XLM is now close to a turnaround. Avalanche (AVAX)The market capitalization is $15.34 billion. To become a top 10 cryptocurrency, it would need to add more than $5 billion to its market capitalization. Tron (TRX).

This rise could occur considering that XLM’s market capitalization increased from approximately $9.8 billion to $14 billion in the first five days of 2025. However, these gains will depend on whether Stellar can continue and maintain its upward trend.

Next: Anthony Pompliano’s Bitcoin Proposal: ‘BTC Could Go Much Higher’

Share. Facebook Twitter Pinterest LinkedIn Tumblr Email

Related Posts

Bitcoin price model indicates lowest potential

April 2, 2026

Coinbase Adds Little-Known Crypto Assets to Spot Trading Listing Roadmap

March 26, 2026

RWA increases by 8% in 30 days – is it more than just a ‘safe’ bet?

March 19, 2026
Add A Comment

Comments are closed.

Recent Posts

Charles Schwab prepares to offer Bitcoin, Ethereum spot trading

April 4, 2026

Ether risks a $1.7K retest as traders fail to overcome a key resistance area.

April 4, 2026

Videos and Podcasts | Vault12

April 3, 2026

Bitcoin holds $68,000, but confidence is gone

April 3, 2026

Ripple Forecast -What To Expect For XRP Price In 2026

April 3, 2026

Proof Of Liquidity -A New Era In Blockchain Economics

April 3, 2026

BTCC Exchange Named Official Regional Partner Of The Argentine National Team

April 2, 2026

AI giant Meta, Microsoft, NVIDIA check stocks amid Iran threat, AI cryptocurrency collapse

April 2, 2026

Phemex Publishes April 2026 Proof Of Reserves, Reporting 131% Total Reserve Ratio

April 2, 2026

Cango Inc. Completes $65M Investment And Secures $10M Convertible Note Financing

April 2, 2026

Bybit Kazakhstan Launches KZT/USDT Spot Trading, Enabling Direct Access To Crypto Markets Using Local Currency

April 2, 2026

Crypto Flexs is a Professional Cryptocurrency News Platform. Here we will provide you only interesting content, which you will like very much. We’re dedicated to providing you the best of Cryptocurrency. We hope you enjoy our Cryptocurrency News as much as we enjoy offering them to you.

Contact Us : Partner(@)Cryptoflexs.com

Top Insights

Charles Schwab prepares to offer Bitcoin, Ethereum spot trading

April 4, 2026

Ether risks a $1.7K retest as traders fail to overcome a key resistance area.

April 4, 2026

Videos and Podcasts | Vault12

April 3, 2026
Most Popular

Analysts say Polygon (MATIC) price is facing a critical turning point that could trigger a 50% rebound.

December 16, 2023

NVIDIA DGX Cloud offers a new benchmarking template for AI optimization.

February 12, 2025

NEAR Price Soars 18% in 24 Hours: Is the Forecast Favoring the Bulls?

December 20, 2023
  • Home
  • About Us
  • Contact Us
  • Disclaimer
  • Privacy Policy
  • Terms and Conditions
© 2026 Crypto Flexs

Type above and press Enter to search. Press Esc to cancel.