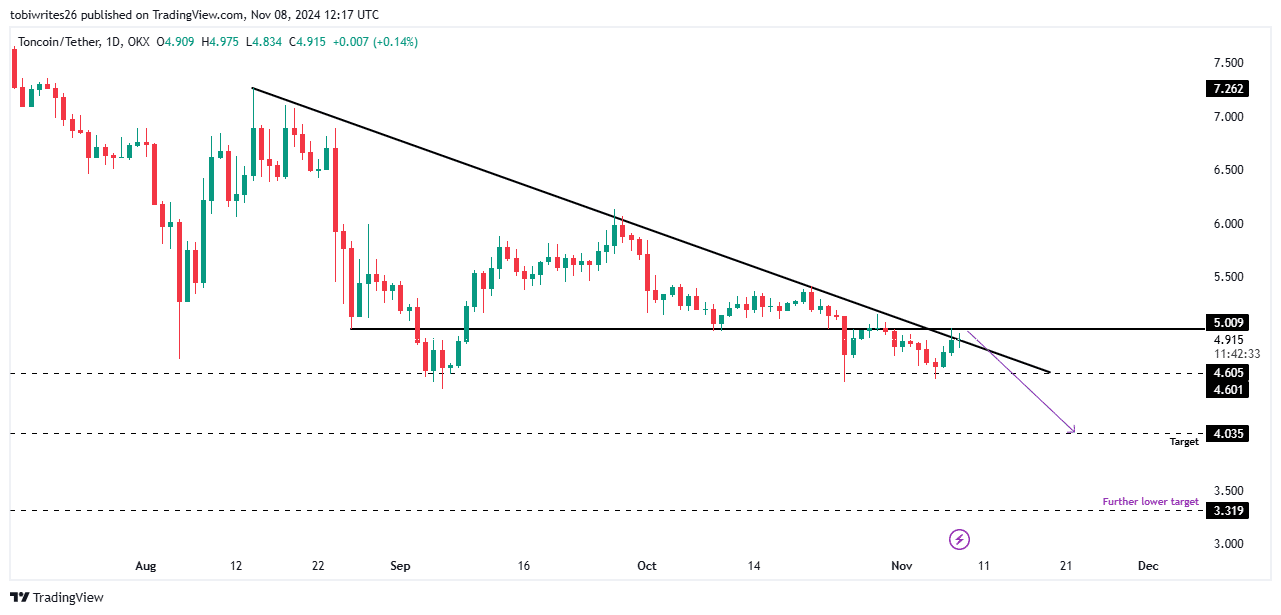
- At press time, the asset was trading near levels of strong selling pressure that could push the price lower.
- Bearish sentiment appeared to be on the rise, but recovery still possible
TON’s performance has been a mix of gains and losses over recent periods. In fact, at the time of writing, it is down 4.95% over the past month, but has bounced back 1.19% on a weekly basis.
However, recent price action has suggested that TON could face a sharp decline and potentially fall further as selling pressure mounts.
Selling pressure met resistance as TON struggled at key levels.
TON has reached a critical point on the price chart. Despite forming a bullish triangle pattern that typically signals a rally, TON has yet to break out of the uptrend and appears poised to decline as of press time.
TON appears to be facing significant resistance at $5.009. This level is known for strong selling pressure that can cause prices to stagnate or fall.

Source: Trading View
This resistance level is consistent with the In/Out of the Money Around Price (IOMAP) indicator, showing $80.9 million worth of TON sell orders from 5.1 million addresses at an average price of $4.93 (range 4.88-5.03).


Source: IntoTheBlock
It is worth pointing out here that IOMAP tracks where holders have purchased based on press time prices, which helps identify key areas of support and resistance.
With selling pressure growing, TON is likely to target the next support at $4.035, a level last seen in March 2024. If these pressures continue, the asset could face a further decline to $3.319.
Control is weakening as selling pressure pulls TON south.
According to analysis by AMBCrypto, TON has been under continued selling pressure recently. In fact, open interest, which measures the number of outstanding futures contracts, has been trending downward since August 27th.
This decline in open interest implied a decline in market participation and contributed to the price of TON falling further into bearish territory.
Open interest, a measure of market activity and liquidity, has not seen a reversal since. Without this, TON is expected to remain vulnerable to downward pressure.


Source: Coinglass
Additionally, recent liquidation data shows that long-term traders are seeing increasing losses as the price of TON moves relative to upside bets. At press time, approximately $151,620 worth of long positions were liquidated. Continued price declines are likely to lead to additional long-term liquidations, intensifying downward pressure.
TON’s downward trend is likely to continue due to decreased open interest and increased long-term liquidation.
However, looking at recent exchange leaked data, there may be some optimism. The massive TON outflow recorded by Coinglass suggests that investors are turning to long-term holding rather than selling. When an asset is moved off an exchange, this often reflects trust in the asset. Especially if the holder intends to hold it for a long period of time.


Source: Coinglass
In the last 24 hours, $3.35 million worth of TON left the exchange, and $17.38 million was withdrawn in the last 7 days. These outflows may have helped temporarily support the price of TON against the downtrend.
If this outflow trend continues, TON may stabilize. However, if outflows slow down, TON may suffer further losses on the charts.

