The price of XRP faces uncertainty about its future. This is because when looking at the price charts and on-chain performance, two distinct signals can be observed.
Will XRP succumb to the downtrend or move in favor of the uptrend?
Ripple price rise proves top market conditions
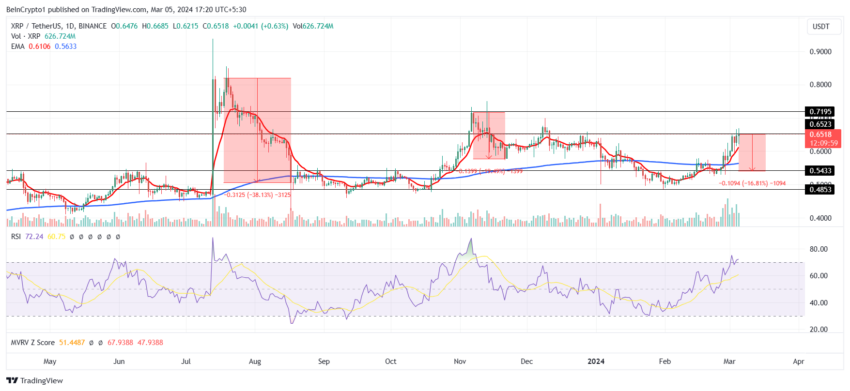
Despite not causing any ripples on the daily charts, the price of XRP rose by more than 30% throughout February. At the time of writing, the altcoin is trading at $0.651, just below the resistance level of $0.652.
Altcoins face two natural outcomes: break a resistance level or test it as support. Or, you may not be able to break through the barrier and witness correction. The evolution of cryptocurrency values supports the latter result.
The Market Value to Realized Value (MVRV) ratio is a metric that evaluates an investor’s average profit or loss when acquiring an asset. In particular, the 30-day MVRV ratio provides insight into the average profit or loss for investors who made purchases in the previous month.
Read More: Ripple XRP Price Prediction for 2024/2025/2030
In the case of Ripple, the current 30-day MVRV is 9.9%, so investors who purchased XRP over the past month earned 9.9%. These gains mean that XRP is meeting the market’s best conditions. As a result, these investors may sell off their holdings to capitalize on profits, potentially triggering a sell-off.
Historical data shows that when MVRV reaches 7.4% to 20.2%, Ripple often undergoes significant corrections, identifying this range as a “risk zone” on the charts.
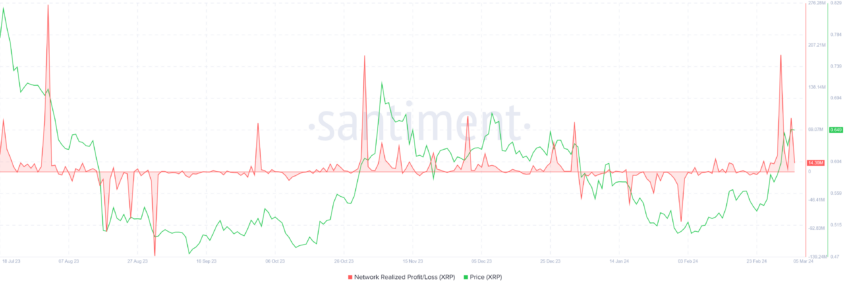
Moreover, investors are witnessing their first profits in over two months, making them all more vulnerable to profit taking. Network realized P&L showed a surge in profits since the beginning of the month.

These factors may contribute to a potential sell-off, which could result in a decline in asset prices.
XRP Price Prediction: Golden Cross Defense
XRP price is witnessing its first golden cross in five months, thanks to a 30% rise throughout February. The Golden Cross is a bullish technical analysis pattern.
This occurs when a short-term moving average (usually the 50-day exponential moving average (EMA)) crosses a long-term moving average (usually the 200-day EMA).

This event signals a potential shift from a bearish to a bullish trend, indicating increasing momentum and investor confidence. This is often interpreted as a buy signal in anticipation of further price rises.
However, investors should refrain from selling their holdings for the Golden Cross to become significant. Additionally, a push above the $0.652 barrier to turn it into support would validate the cross.
Read more: How to Buy XRP and Everything You Need to Know
However, if these conditions are not met and the XRP price adjusts, Golden Cross may fail. Currently, the Relative Strength Index (RSI) is already inching closer to overbought.
When XRP becomes overbought, altcoins correct as historically noted. As a result, the altcoin may fall to test the support level of $0.543, resulting in a 16% price decline.
disclaimer
All information contained on our website is published in good faith and for general information purposes only. Any action you take upon the information on our website is strictly at your own risk.

