Crypto Flexs
  • DIRECTORY
  • CRYPTO
    • ETHEREUM
    • BITCOIN
    • ALTCOIN
  • BLOCKCHAIN
  • EXCHANGE
  • TRADING
  • SUBMIT
Crypto Flexs
  • DIRECTORY
  • CRYPTO
    • ETHEREUM
    • BITCOIN
    • ALTCOIN
  • BLOCKCHAIN
  • EXCHANGE
  • TRADING
  • SUBMIT
Crypto Flexs
Home»ALTCOIN NEWS»What Polkadot’s ‘Falling Wedge’ Breakout Means for Traders
ALTCOIN NEWS

What Polkadot’s ‘Falling Wedge’ Breakout Means for Traders

By Crypto FlexsDecember 23, 20243 Mins Read
Facebook Twitter Pinterest LinkedIn Tumblr Email
What Polkadot’s ‘Falling Wedge’ Breakout Means for Traders
Share
Facebook Twitter LinkedIn Pinterest Email
  • A falling wedge break indicates bullish potential, with key resistance at $10.88 targeting $24.
  • Positive indicators, including an oversold RSI and strong social sentiment, strengthen Polkadot’s rally potential.

Polkadot (DOT) It broke out of a descending wedge pattern on weekly time frames, which is an important signal ahead of a significant bullish rally.

Trading at $6.83 at press time and down 1.98% at press time, the breakout and retest phase for the cryptocurrency presents a promising opportunity for traders. The next key question is whether DOT can maintain this momentum and rebound towards its medium-term target of $24.

DOT Breakout and Price Prediction

A breakout of the descending wedge on the Polkadot chart highlights the strong potential for a bullish reversal. The price is currently facing the first major resistance at $10.88, with an intermediate target of $24.

Additionally, a retest of the recent breakout level strengthens the technical outlook, suggesting buyers are entering a critical mass. Therefore, DOT’s trajectory appears to have significant upside if the momentum continues.
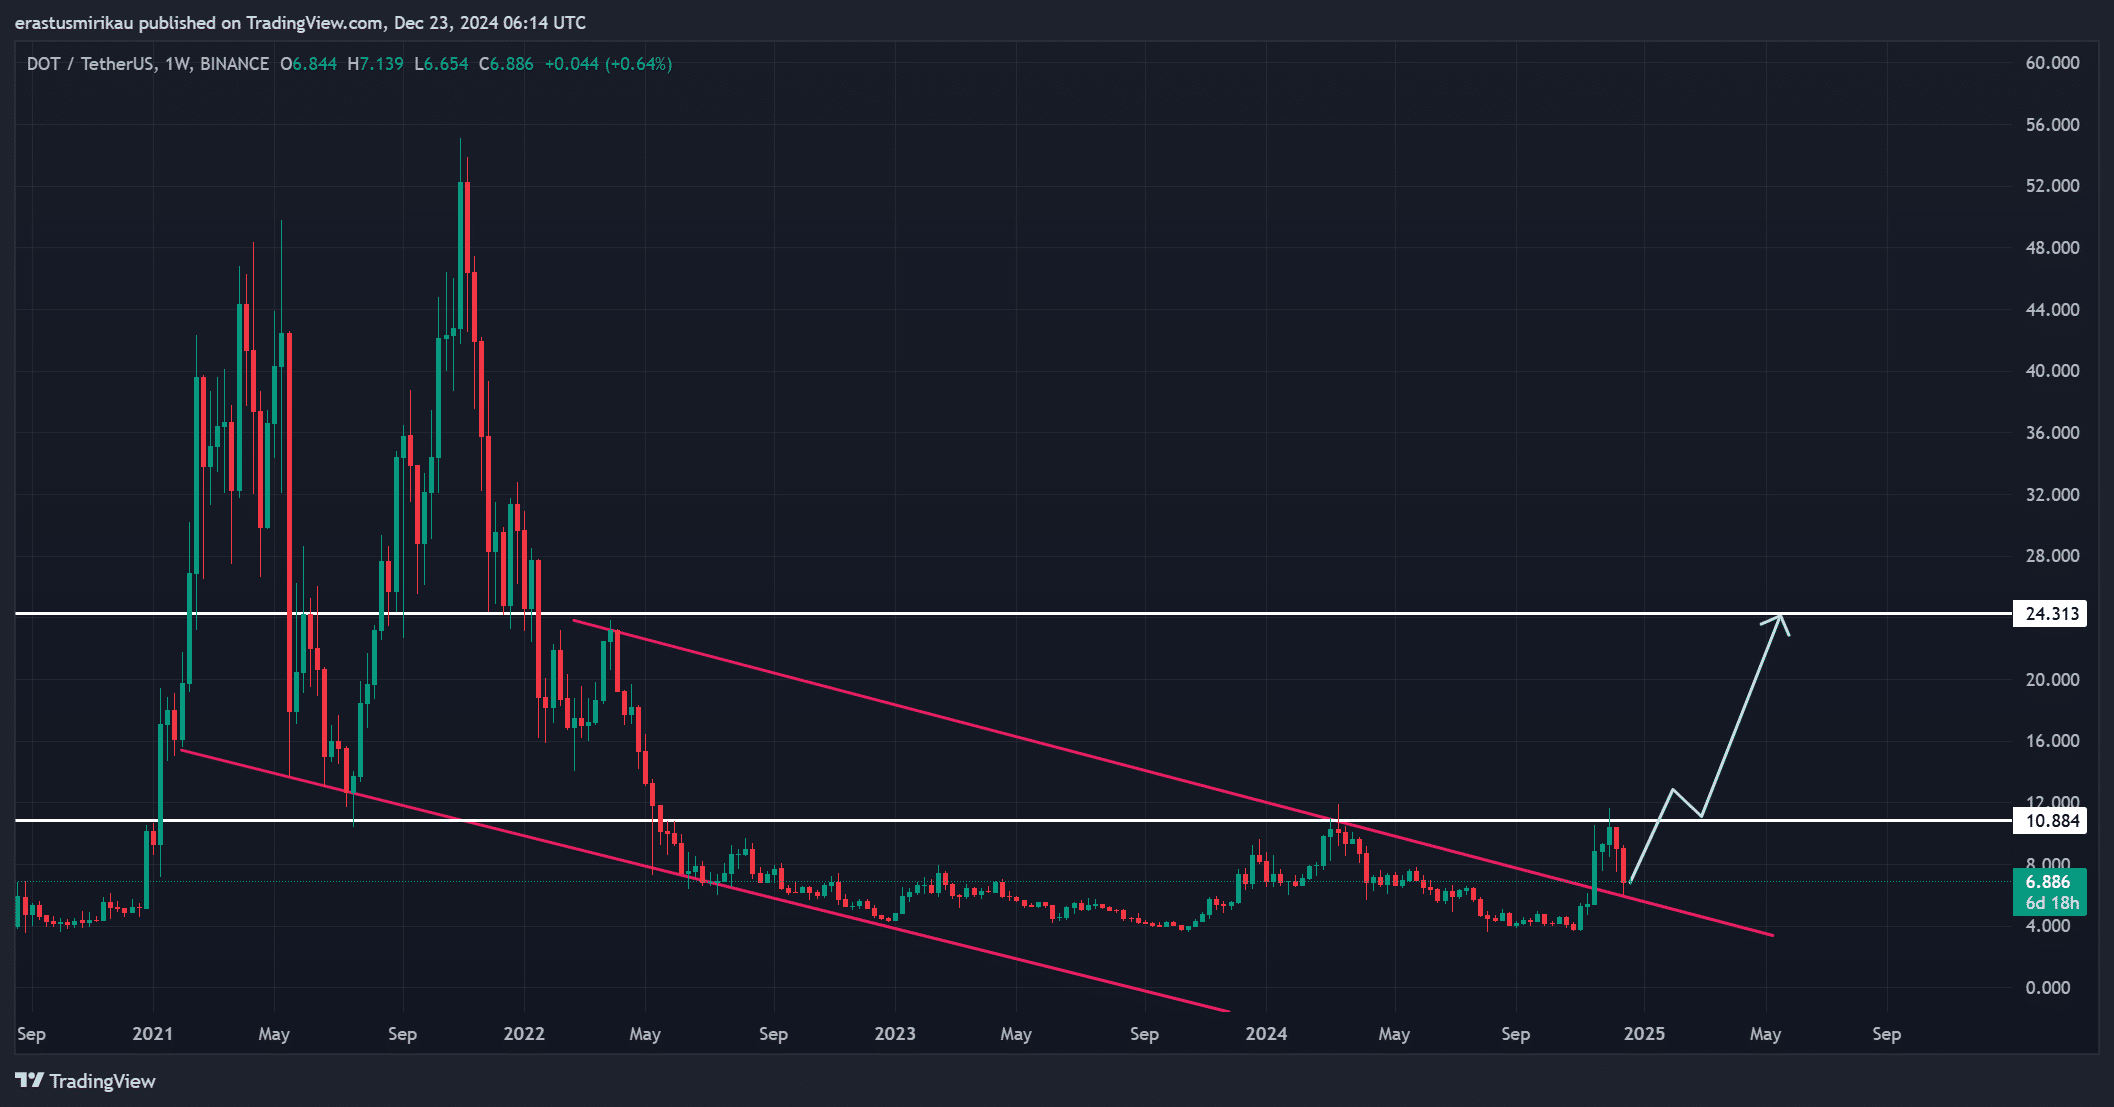
DOT PA analysis

Source: TradingView

Stochastic RSI and Moving Average Analysis

Technical indicators further support Polkadot’s bullish potential. The stochastic RSI is close to 3.03 and 4.01, indicating oversold conditions and a possible near-term price rebound.

Additionally, the moving average (MA) crossover on the daily chart suggests a near-term consolidation, but also suggests that DOT may soon reverse the downtrend.

Together, these indicators indicate a promising outlook for cryptocurrencies in the coming weeks.
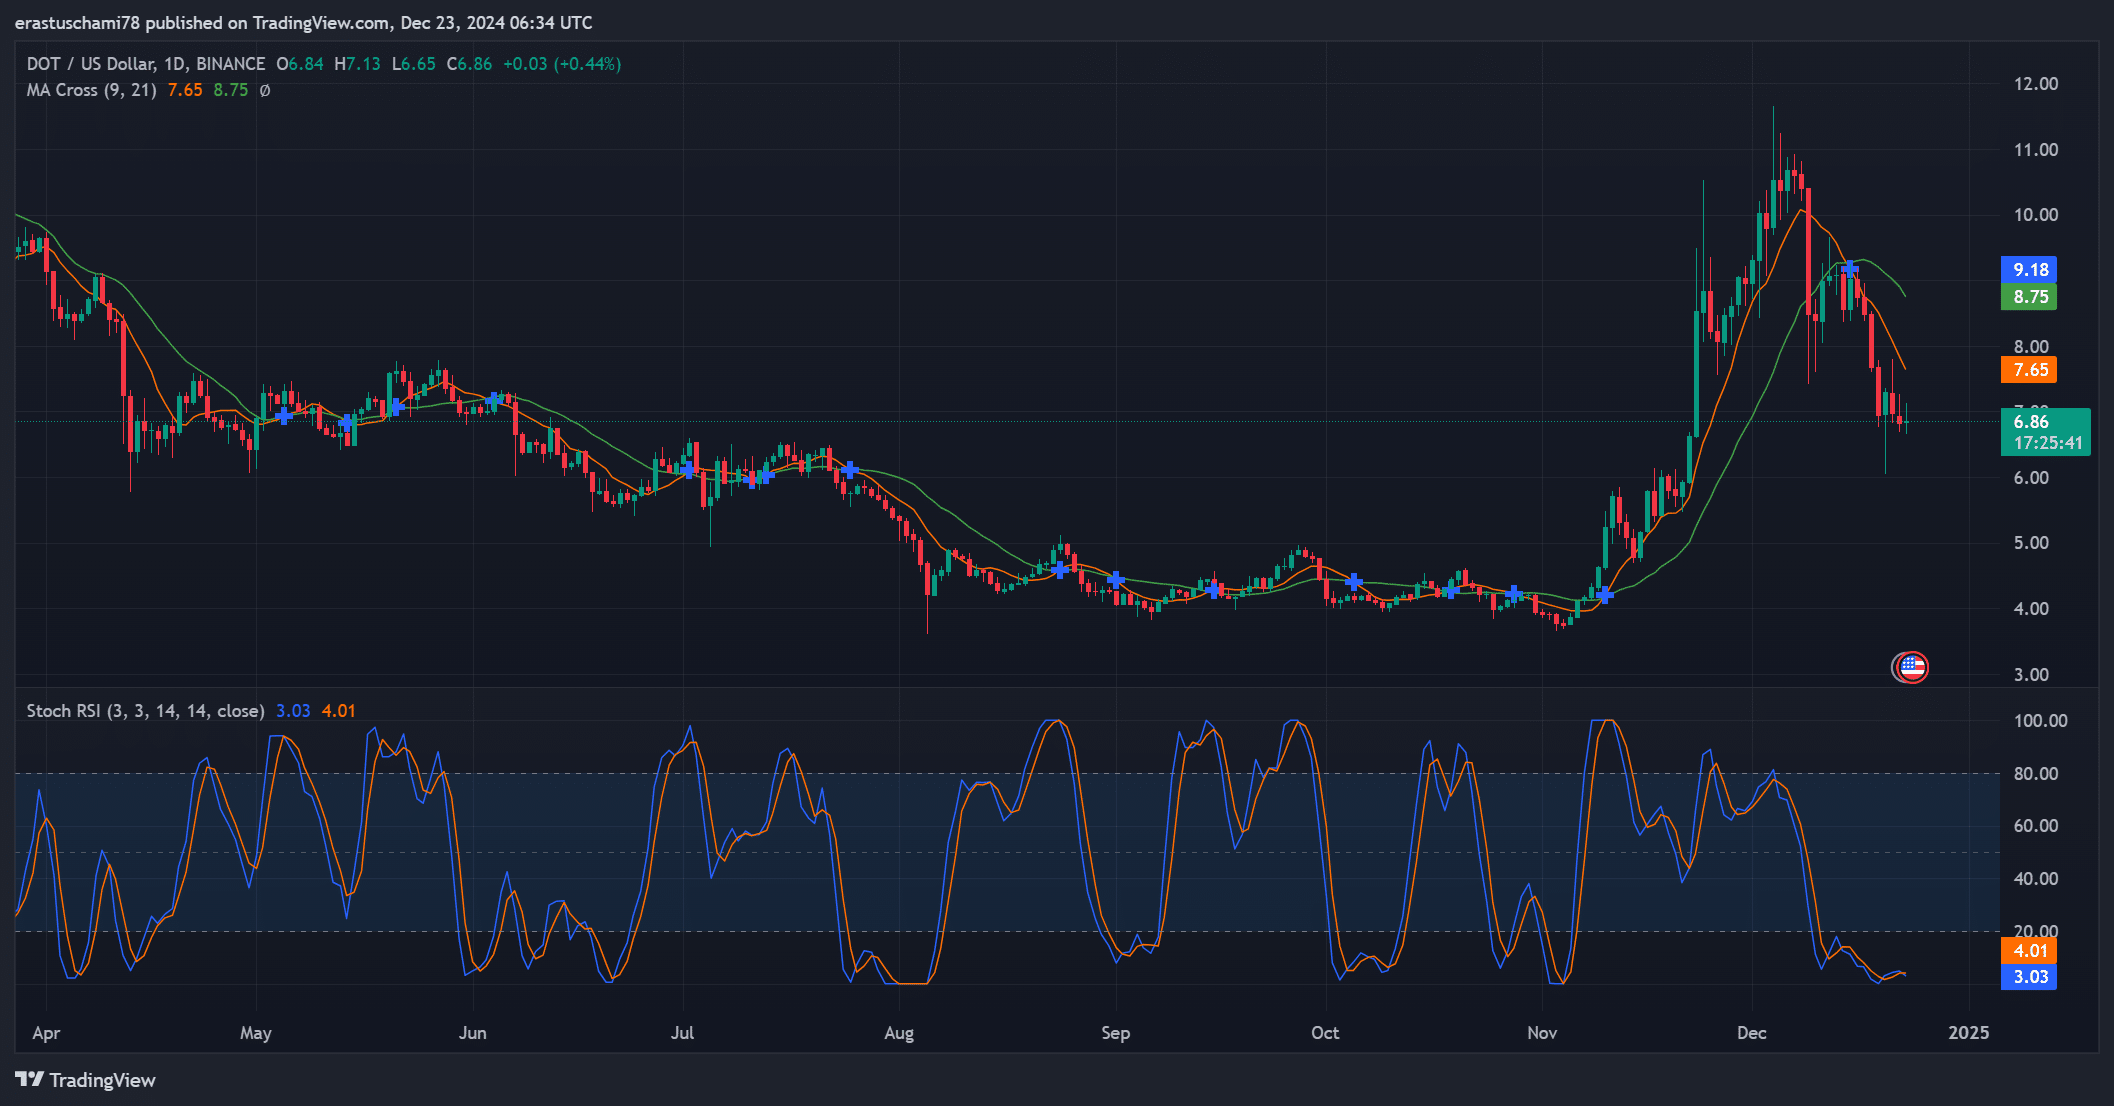
DOT technical indicators DOT technical indicators

Source: TradingView

Social volume data of 105 points to growing interest in Polkadot as community engagement continues to grow across the platform. This heightened activity, noticeable through sustained surges, is often associated with renewed interest in an asset.

Therefore, the narrative surrounding Polkadot’s bullish potential continues to grow, creating a positive feedback loop for both sentiment and price action.
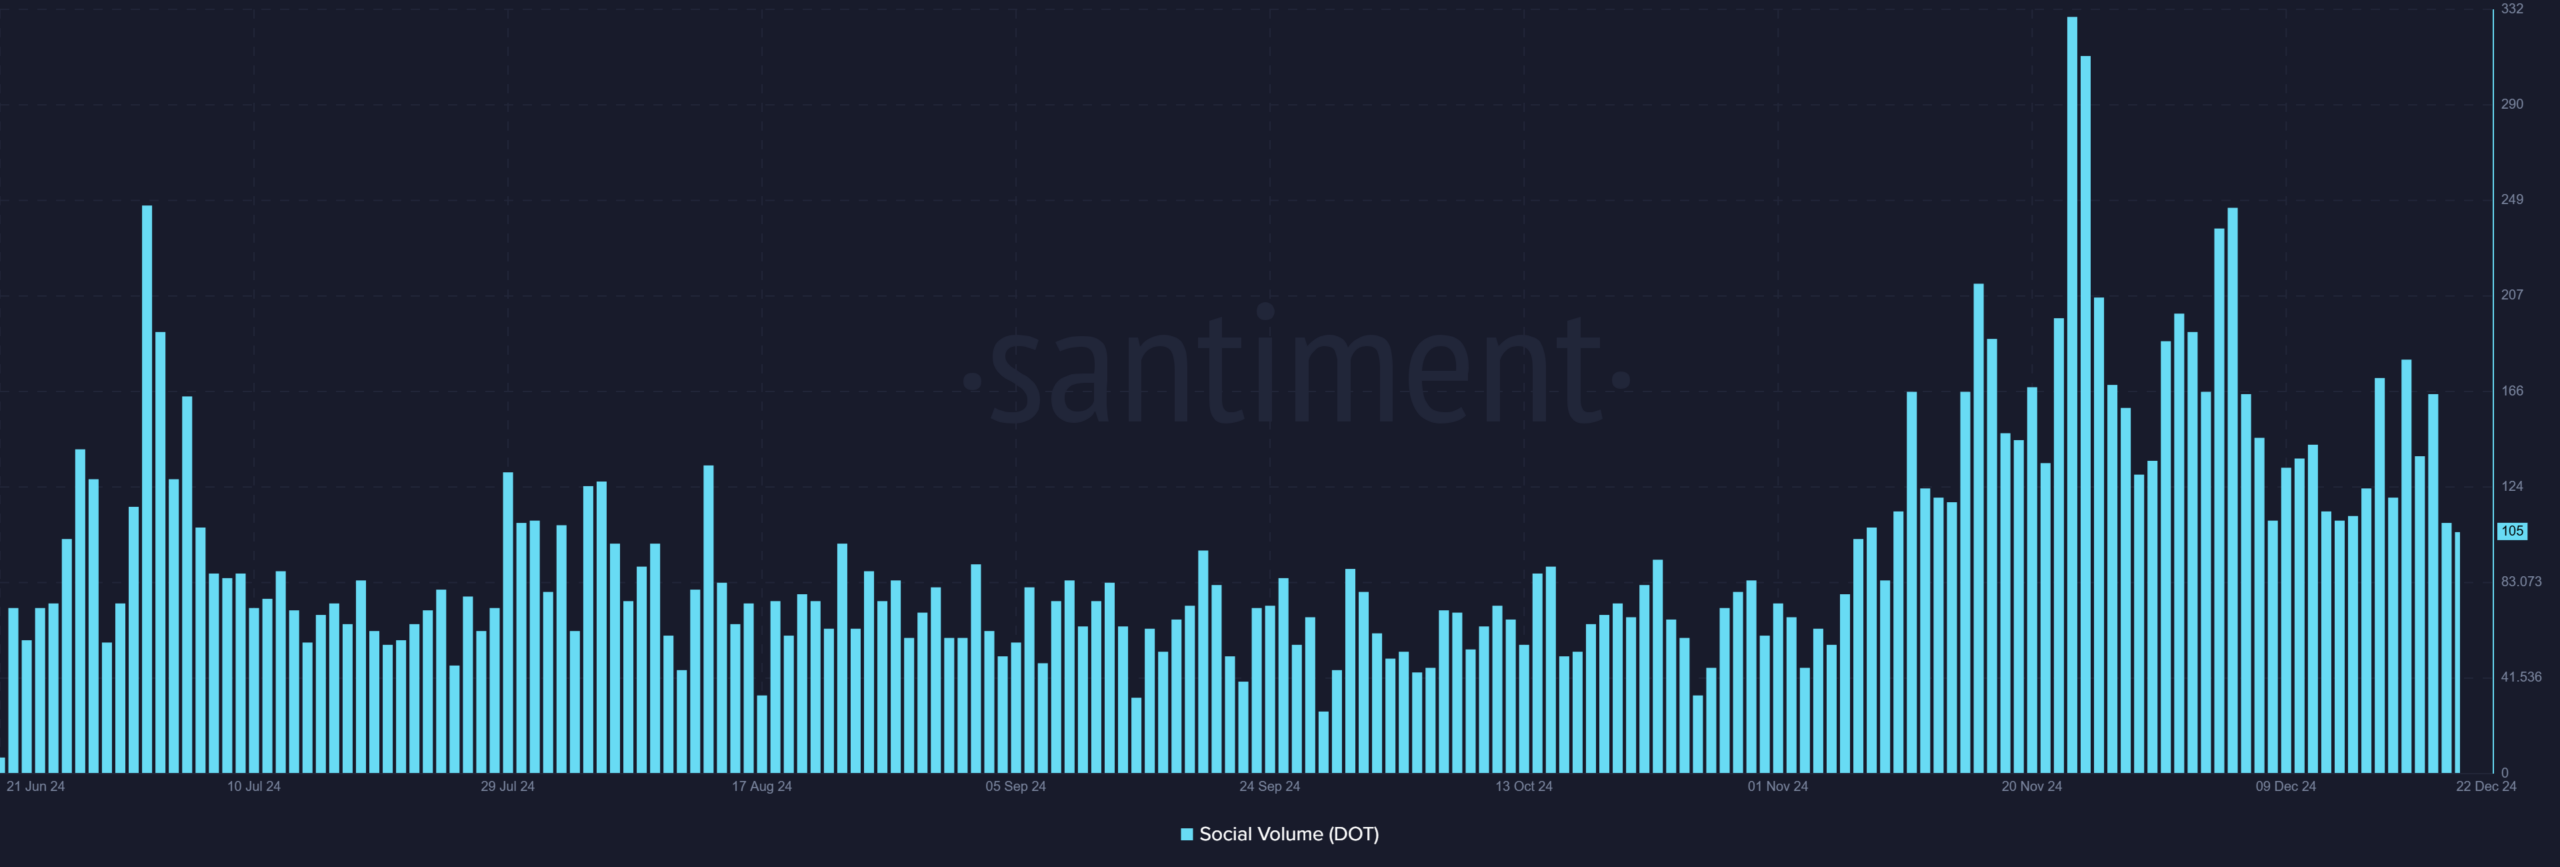
Source: Santiment

DOT Derivatives Market Supports Optimistic Outlook

Polkadot’s total liquidations show $207.51K in long liquidations compared to $177.75K in shorts, indicating growing confidence among long traders. Additionally, the OI-weighted funding ratio remains positive at 0.01%, reinforcing bullish sentiment.

These indicators indicate that Polkadot is showing strength in the derivatives market, further solidifying its upside potential.
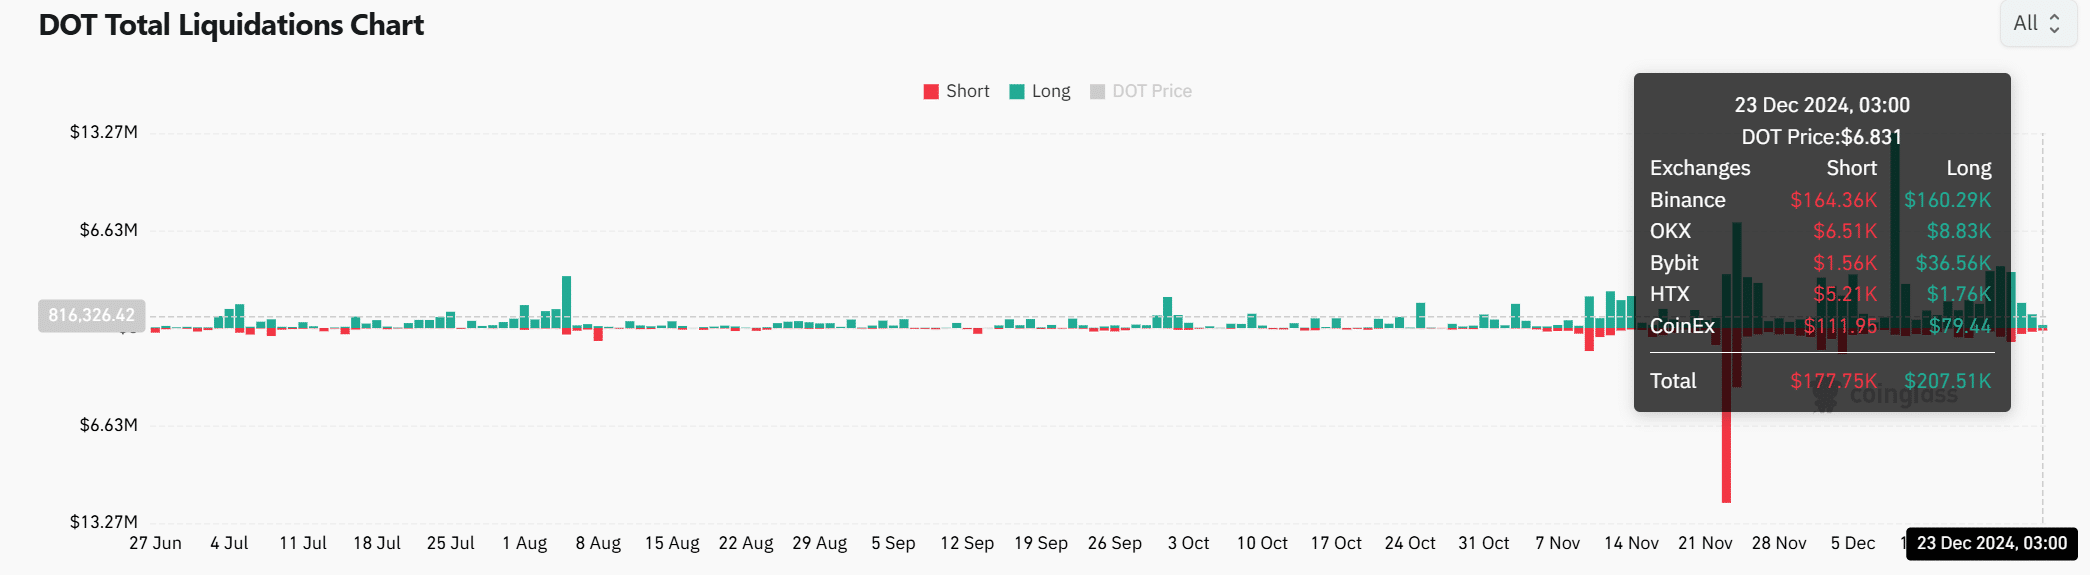
Source: Coinglass


Read Polkadot (DOT) Price Forecast for 2024-2025


With a falling wedge breakout, bullish technical indicators, and increasing social and derivatives momentum, Polkadot appears well-positioned for a rally.

Overcoming the $10.88 resistance is important, but if the current momentum continues, the medium-term target of $24 is also achievable. Polkadot is undoubtedly headed for a significant breakthrough.

Next: 362,380 LINKs moved in 48 hours: Here’s the current activity of Chainlink whales:

Share. Facebook Twitter Pinterest LinkedIn Tumblr Email

Related Posts

3/11 Price Prediction: BTC, ETH, BNB, XRP, SOL, DOGE, ADA, BCH, HYPE, XMR

March 12, 2026

Institutions are returning to Ethereum as staking records hit record highs.

March 5, 2026

Strategy adds 592 BTC to milestone purchases

February 26, 2026
Add A Comment

Comments are closed.

Recent Posts

Phemex TradFi Hits $10B Monthly Volume, Advancing Cross-Market Trading Infrastructure

March 12, 2026

BMNR), Cathie Wood’s ARK Invest, And Payward To Expand Into Next Generation Technology

March 12, 2026

Ethereum attempts to hold above $2,000 as whales withdraw $155 million from ETH.

March 12, 2026

PrimeXBT Launches PXTrader 2.0, Bringing Crypto And Traditional Markets Into One Trading Platform

March 12, 2026

BYDFi Perpetual Futures Data Now Live On TradingView

March 12, 2026

3/11 Price Prediction: BTC, ETH, BNB, XRP, SOL, DOGE, ADA, BCH, HYPE, XMR

March 12, 2026

Ethereum Price Rejects Again, Market Watches Key Support Closely

March 11, 2026

Ethereum Price Rejects Again, Market Watches Key Support Closely

March 11, 2026

CoinPoker launches new app with Rake Free Poker, recruits Abby Merk and Papo MC

March 11, 2026

This Is Fine (Until the Grant Runs Out)

March 11, 2026

Ether Funds Turn Negative, But Bears Still Retain Control: Why?

March 11, 2026

Crypto Flexs is a Professional Cryptocurrency News Platform. Here we will provide you only interesting content, which you will like very much. We’re dedicated to providing you the best of Cryptocurrency. We hope you enjoy our Cryptocurrency News as much as we enjoy offering them to you.

Contact Us : Partner(@)Cryptoflexs.com

Top Insights

Phemex TradFi Hits $10B Monthly Volume, Advancing Cross-Market Trading Infrastructure

March 12, 2026

BMNR), Cathie Wood’s ARK Invest, And Payward To Expand Into Next Generation Technology

March 12, 2026

Ethereum attempts to hold above $2,000 as whales withdraw $155 million from ETH.

March 12, 2026
Most Popular

3 reasons why Ethereum price is headed to $4,000

November 13, 2024

Layer 3 Degen Chain has not produced a block for 11 hours.

May 13, 2024

Why is SKY rising +8% while other cryptocurrencies are in the red?

January 25, 2026
  • Home
  • About Us
  • Contact Us
  • Disclaimer
  • Privacy Policy
  • Terms and Conditions
© 2026 Crypto Flexs

Type above and press Enter to search. Press Esc to cancel.