This article is also available in Spanish.
Ethereum (ETH), the second-largest cryptocurrency by market capitalization, appears to be gaining attention as analysts watch market indicators indicating ETH’s next move.
Recent data from CryptoQuant highlights accumulation and exchange-traded fund (ETF) inflow patterns, providing more insight into the potential trajectory of Ethereum underperforming Bitcoin in the current cycle.
Related Reading
Cumulative and ETF inflow trend analysis
CryptoQuant analysts analyzed key indicators for Ethereum in a series of posts shared on social media platform X. One notable observation was Ethereum’s cumulative address balance. These addresses currently hold approximately 19.5 million ETH, valued at approximately $78 billion.
For comparison, Bitcoin hoarding addresses hold approximately 2.8 million BTC, or $280 billion worth. Although the dollar value of Bitcoin held is four times higher than that of Ethereum, this is consistent with relative market capitalization, providing insight into investor behavior.
Another important indicator receiving attention has been the steady flow of inflows into Ethereum-focused ETFs over the past few months. Notable spikes were recorded on several key dates, including $1.1 billion on November 11 and $839 million on December 4, 2024.
According to CryptoQuant analysts, these continued inflows are a strong indicator of institutional buying interest and reinforce Ethereum’s growing appeal among large investors.
The Ethereum ETF has seen steady inflows in recent months.
Main spikes:
November 11, 2024: $1.1 billion
November 21, 2024: $754 million
November 25, 2024: $629 million
November 27, 2024: $883M
December 4, 2024: $839 millionThese inflows reflect strong buying pressure. pic.twitter.com/OIwWNmRPYB
— CryptoQuant.com (@cryptoQuant_com) December 10, 2024
Despite strong ETF demand, Ethereum’s price movements have been less dramatic than Bitcoin’s performance this cycle. Historically, Ethereum’s highest prices have followed Bitcoin’s price, as seen during the 2021 bull market.
At that time, Bitcoin reached an all-time high (ATH) with a 480% increase in March, while Ethereum peaked a few months later with an increase of approximately 1,114%. However, in the current cycle, Ethereum appears to be underperforming, indicating a change in market dynamics.
Taker Volume and Potential Growth
Additionally, an important area of interest mentioned by analysts is Ethereum’s taker trading volume, which reflects market sentiment by comparing aggressive buying and selling activity.

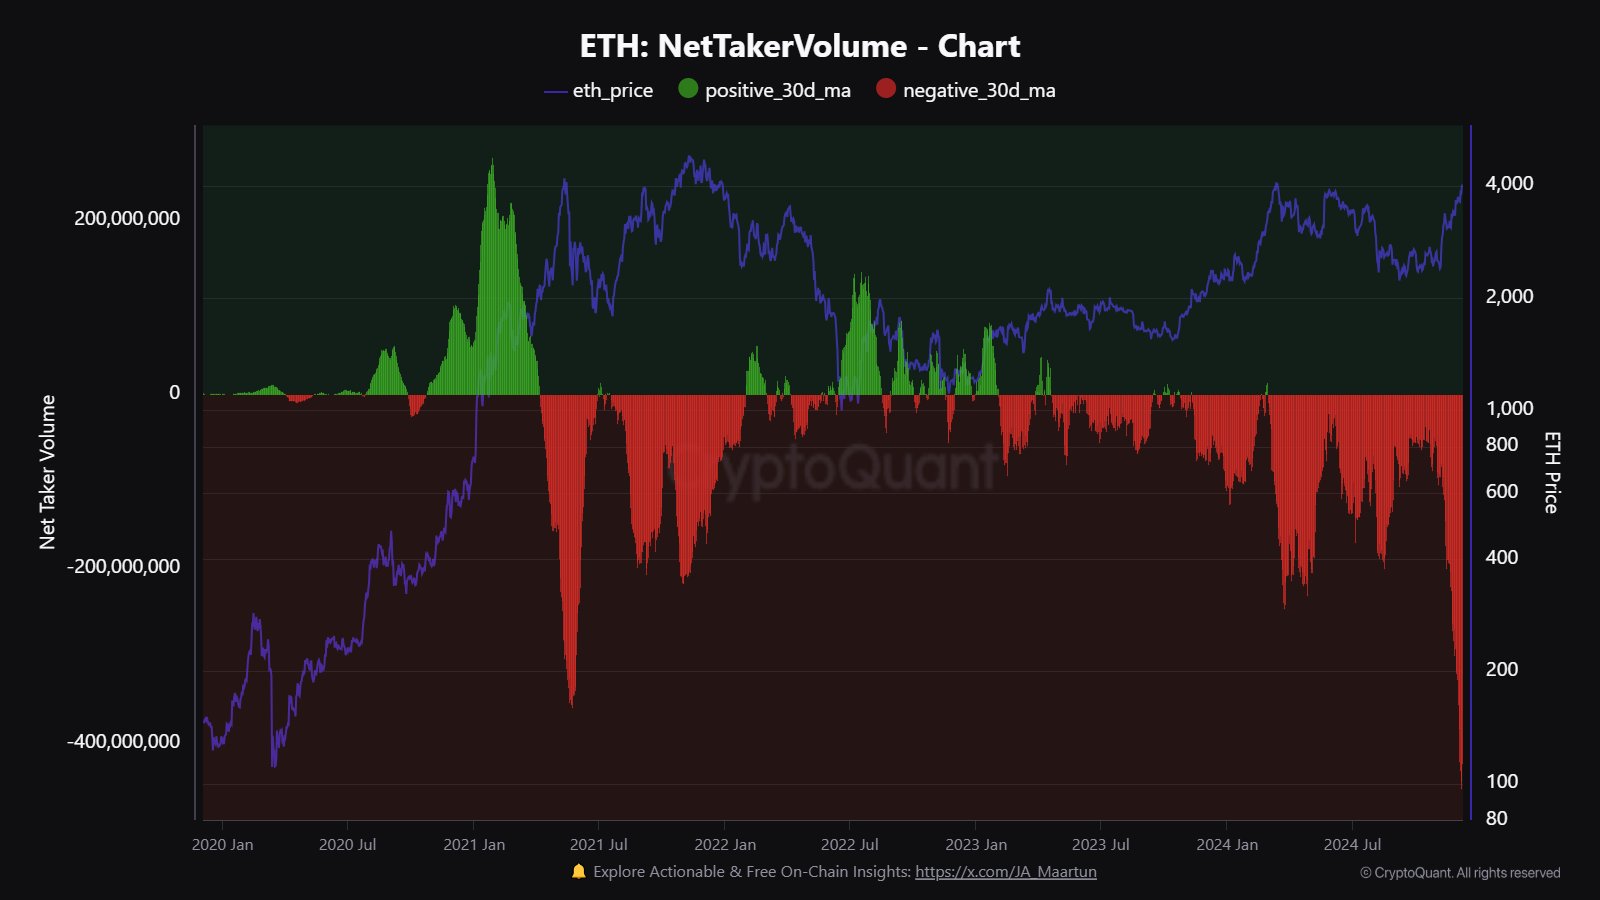
CryptoQuant reported that Ethereum’s taker-seller trading volume hit an all-time low of -400 million. This aggressive selling activity is reminiscent of patterns observed prior to the 2021 ATH. While selling pressure may appear bearish at the moment, it could also be a sign that the market is approaching an important pivot point.
Ethereum Taker volume is at its lowest level on record.
Ethereum’s price weakness is due to high taker-seller trading volume, which is currently at an all-time low of -400 million, indicating aggressive selling.
A similar pattern occurred prior to Ethereum’s May 2021 high. And yet still… pic.twitter.com/OmRYvAzjxI
— CryptoQuant.com (@cryptoQuant_com) December 10, 2024
Analysts emphasized that Ethereum’s poor performance this cycle does not rule out the potential for significant growth.
Related Reading
The interplay between accumulation patterns, ETF inflows, and taker volume suggests that Ethereum still has room for upward momentum.
Featured image created with DALL-E, chart from TradingView
