- AAVE net deposits surged to an all-time high of $35 billion in 2025, driven by renewed interest in DeFi.
- If this network growth continues, it could bode well for AAVE’s price-performance ratio in 2025.
The decentralized finance (DeFi) industry is experiencing a renaissance in 2024, as Total Value Locked (TVL) surged to a two-year high of $154 billion as of December 17.
This growth has fueled interest in DeFi protocols and tokens such as: AAVE.
At its annual review, the AAVE Protocol famous Net deposits reached an all-time high of $35 billion in 2024. Due to this growth, AAVE is now the largest DeFi platform.
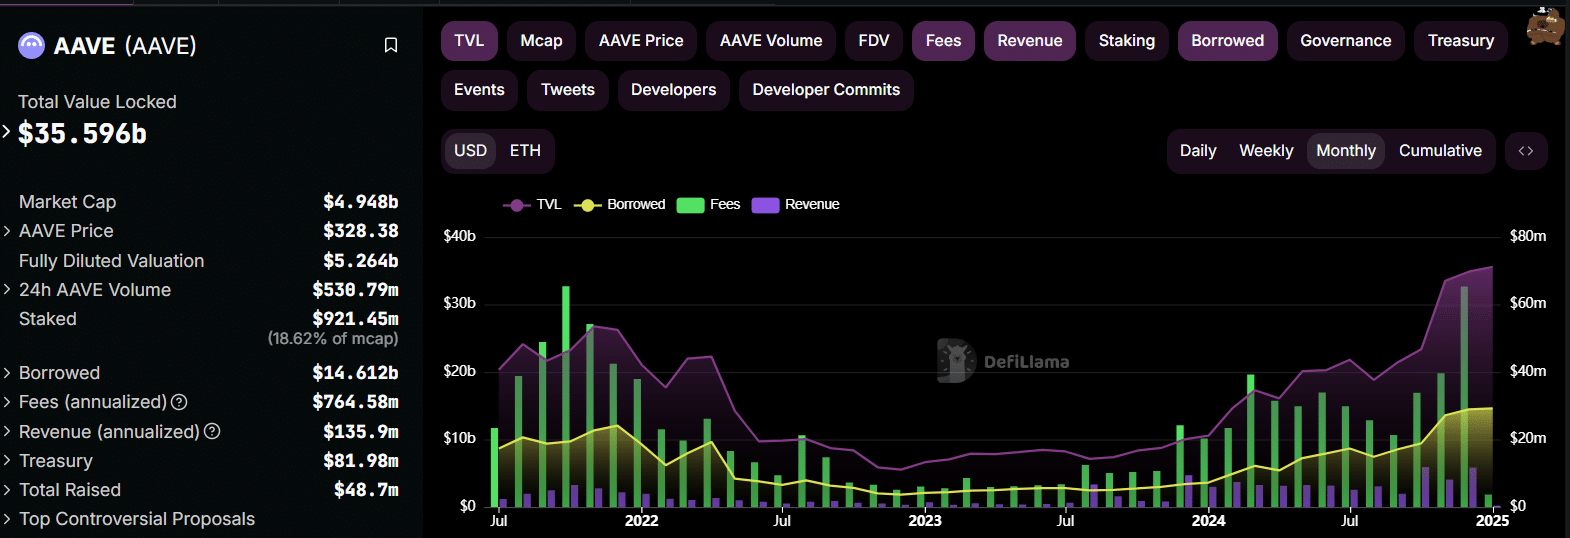
Data from DeFiLlama shows similar growth after the protocol’s total monthly fees rose to a three-year high of $65.34 million. At the same time, revenue reached $11.68 million.
The total amount borrowed by the protocol also increased to more than $14 billion.

Source: DeFiLlama
Increasing activity has led to a rise in the price of AAVE in the fourth quarter of 2024, and if the same growth is recorded this year, it could bode well for the altcoin. However, despite the DeFi renaissance, the token’s daily chart shows a bearish trend.
AAVE Price Analysis
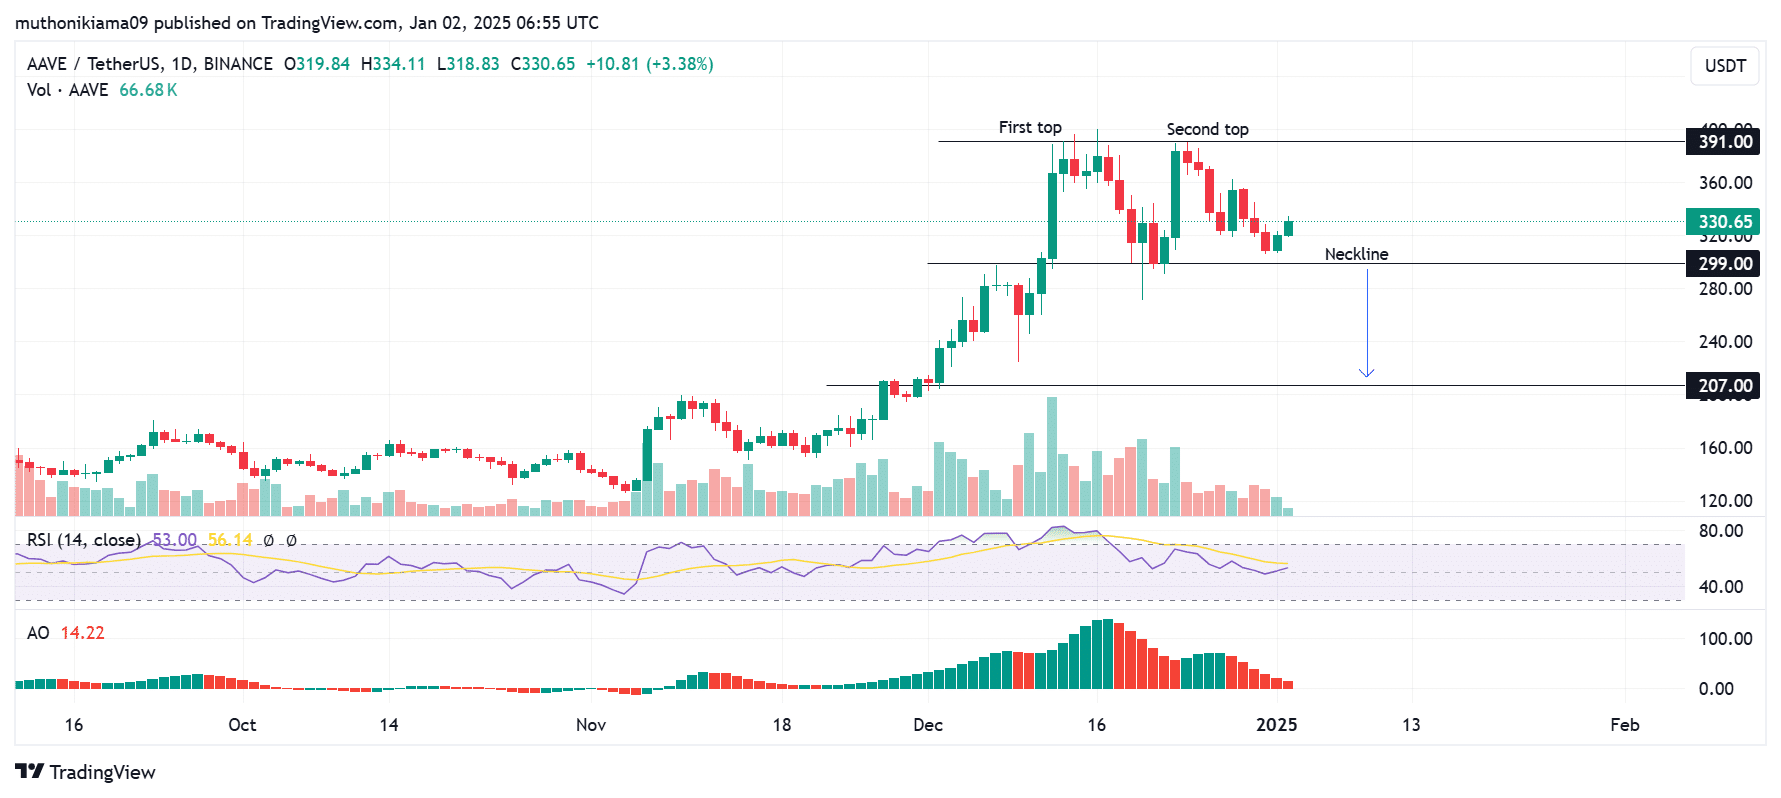
At press time, AAVE was trading at $330 after rising 6.4% in 24 hours. Despite this uptrend, the token’s 1-day chart displayed a bearish double top pattern.
AAVE rebounded to $299 at the neckline of this pattern, indicating that the bulls are fighting for control.
If buying activity, indicated by the volume histogram bars, continues and AAVE reverses resistance at both highs ($391), the bearish thesis indicated by the double top may be invalidated.


Source: TradingView
At the same time, the Relative Strength Index (RSI) line was sloping northward. If this line crosses above the signal line to form a buy signal, it could trigger a rally towards the $391 resistance level.
The Awesome Oscillator also showed that the bearish trend is weakening as the histogram bars get shorter.
Despite these positive signals, traders should be cautious of significant support at the neckline. Because if it falls below this level, it could fall to $207.
What does the long/short ratio mean…
In derivatives, AAVE exhibited a bearish bias due to a decrease in the long/short ratio. At press time, this ratio was 0.95, indicating that there were slightly more traders taking short positions than those taking long positions.


Source: Coinglass
Read Aave (AAVE) price prediction for 2025-2026
While this decline may signal negative sentiment, increasing short positions while prices are rising can lead to selling pressure if those positions are liquidated.
The resulting buying pressure could push AAVE higher.

