- Network activity can be key to SOL’s short-term price movements.
- Positive demand trends provide protection from further downside.
Solana has seen strong ecosystem growth so far in 2024, driven by memecoin and DeFi activity. This growth is reflected in the network’s stablecoin market cap and TVL growth, which has also been very strong. Can these observations give us insight into what to expect from SOL’s price action?
According to DeFiLlama, Solana’s TVL and stablecoin market cap metrics have been rising rapidly so far this year. To put that into perspective, TVL hit its all-time low of $1.396 billion in early 2024, while stablecoin market cap hit a YTD low of $1.83 billion.
Source: DeFiLlama
In our recent evaluation, we found that Solana’s stablecoin market cap is $3.22 billion and TVL is $5.29 billion, meaning that both metrics are now halfway to their all-time highs. But that’s not all.
The recent rally in Solana’s stablecoin market cap pushed it to its all-time high just before mid-July, peaking at $400 million on July 12. Meanwhile, TVL continued to rise despite the broader pullback, a sign that liquidity may be flowing out of stablecoins and into the DeFi ecosystem.
Why Rising TVL Could Indicate Increased Demand for SOL
As stablecoin market caps decline, TVL growth suggests that holders are more confident in moving their funds into Solana’s DeFi ecosystem. If so, demand for DeFi tokens could also drive demand for SOL. This outcome could make it more resilient to downside.
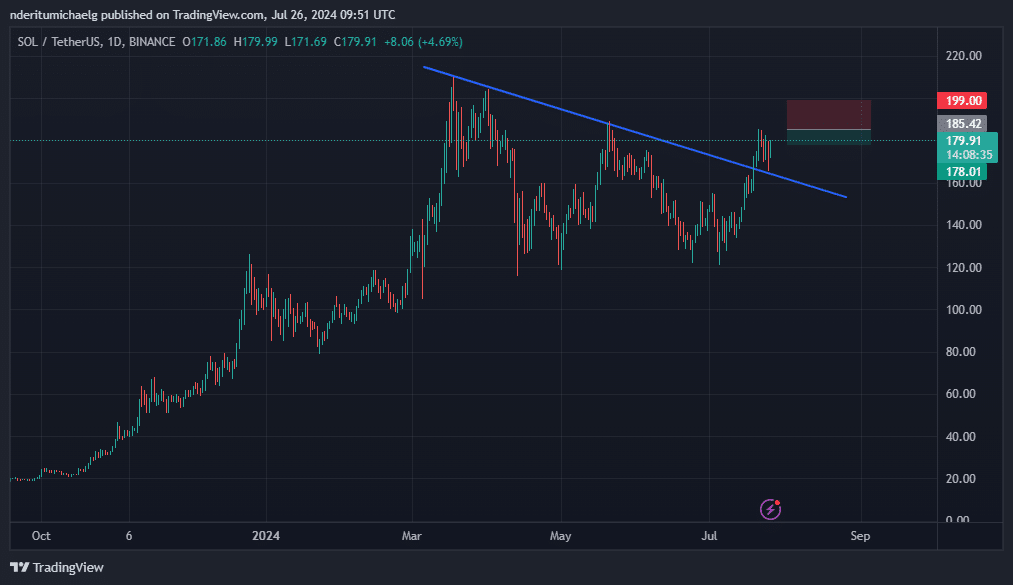
Is SOL headed for another strong breakout? SOL briefly fell into overbought territory a few days ago, but our analysis suggests that bulls are likely to remain dominant. It just came out of a correction phase, and has nonetheless recovered close to its current YTD high.


Source: TradingView
The second key observation is that the recent breakout of the downtrend resistance level is a sign of bullish confidence that could be the start of another expansion into the uptrend.
Strong demand for SOL in the DeFi ecosystem could support a bullish breakout.
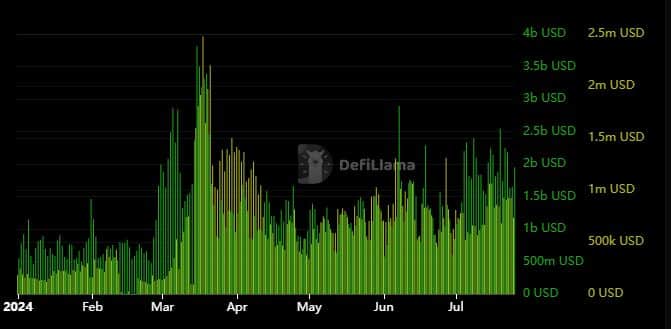
Solana’s on-chain volume and revenue figures slowed between March and April. However, data from May to present suggests that these same metrics have been recovering since then.


Source: DeFiLlama
Transaction volume and revenue figures further support the aforementioned signs of increased network activity.

