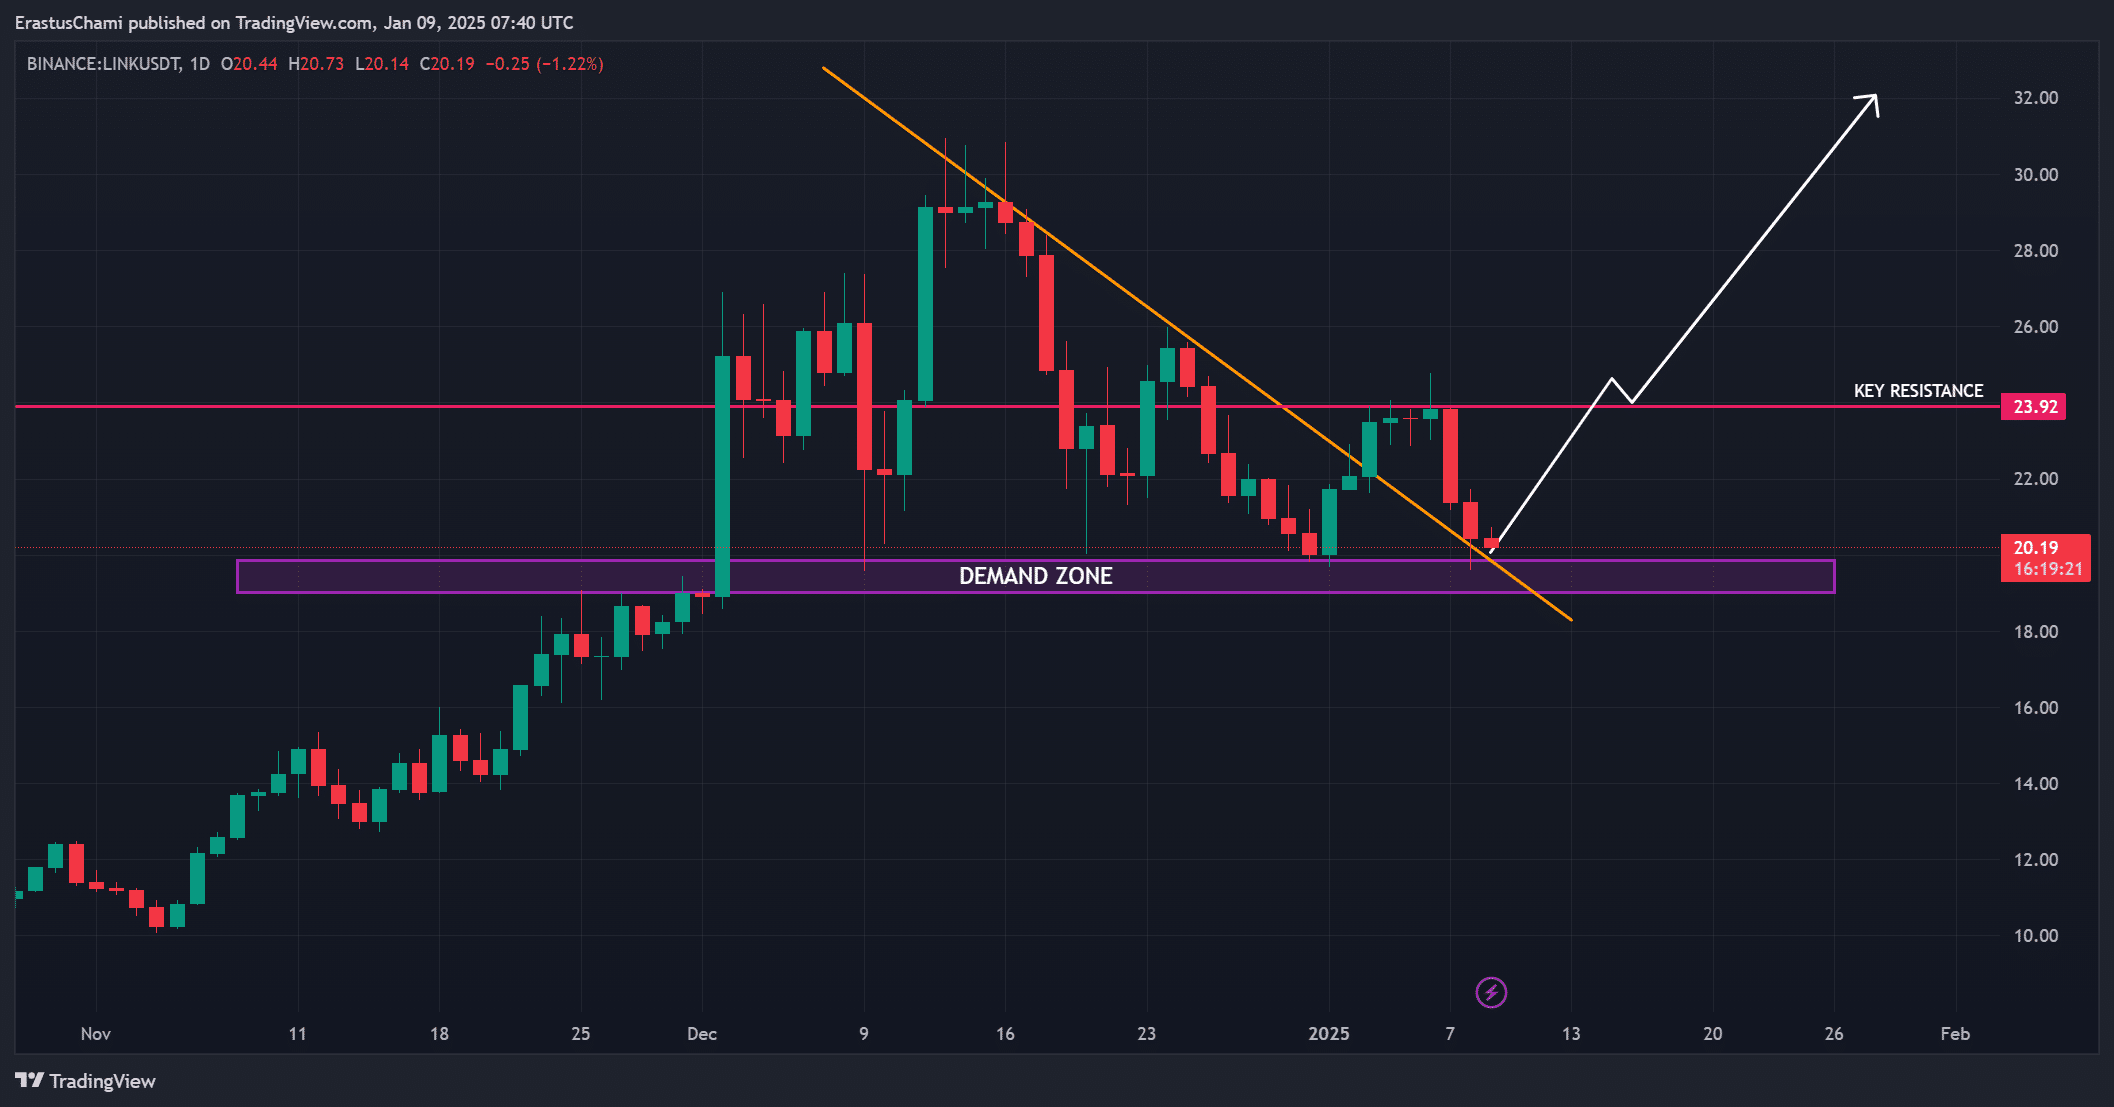
- LINK tested the demand zone again. If it breaks above $23.92, it could rise to $32.
- Network growth and exchange outflows mean accumulation.
Chainlink (LINK) It’s gaining a lot of attention as it retests the descending trendline and demand zone, setting the stage for a potential breakout.
At press time, LINK was trading at $19.84, with a daily decline of 4.39%. Despite the decline, both crowd sentiment and smart money sentiment remained strong, offering hope for a recovery.
LINK Price Action: Can a Key Level Be Overcome?
Current price action suggests that LINK is at a crossroads. After testing the demand zone around $20, the price remained relatively stable, indicating potential for accumulation.
However, the $23.92 resistance level is an important barrier that needs to be cleared for the bullish momentum to resume.
A successful breakout could lead to a significant rise to $32, indicating a major shift in market sentiment.
On the other hand, if the price does not hold within the demand zone, LINK may experience further declines, testing the patience of holders.
Therefore, the next few trading sessions will likely play a pivotal role in shaping LINK’s trajectory.

Source: TradingView
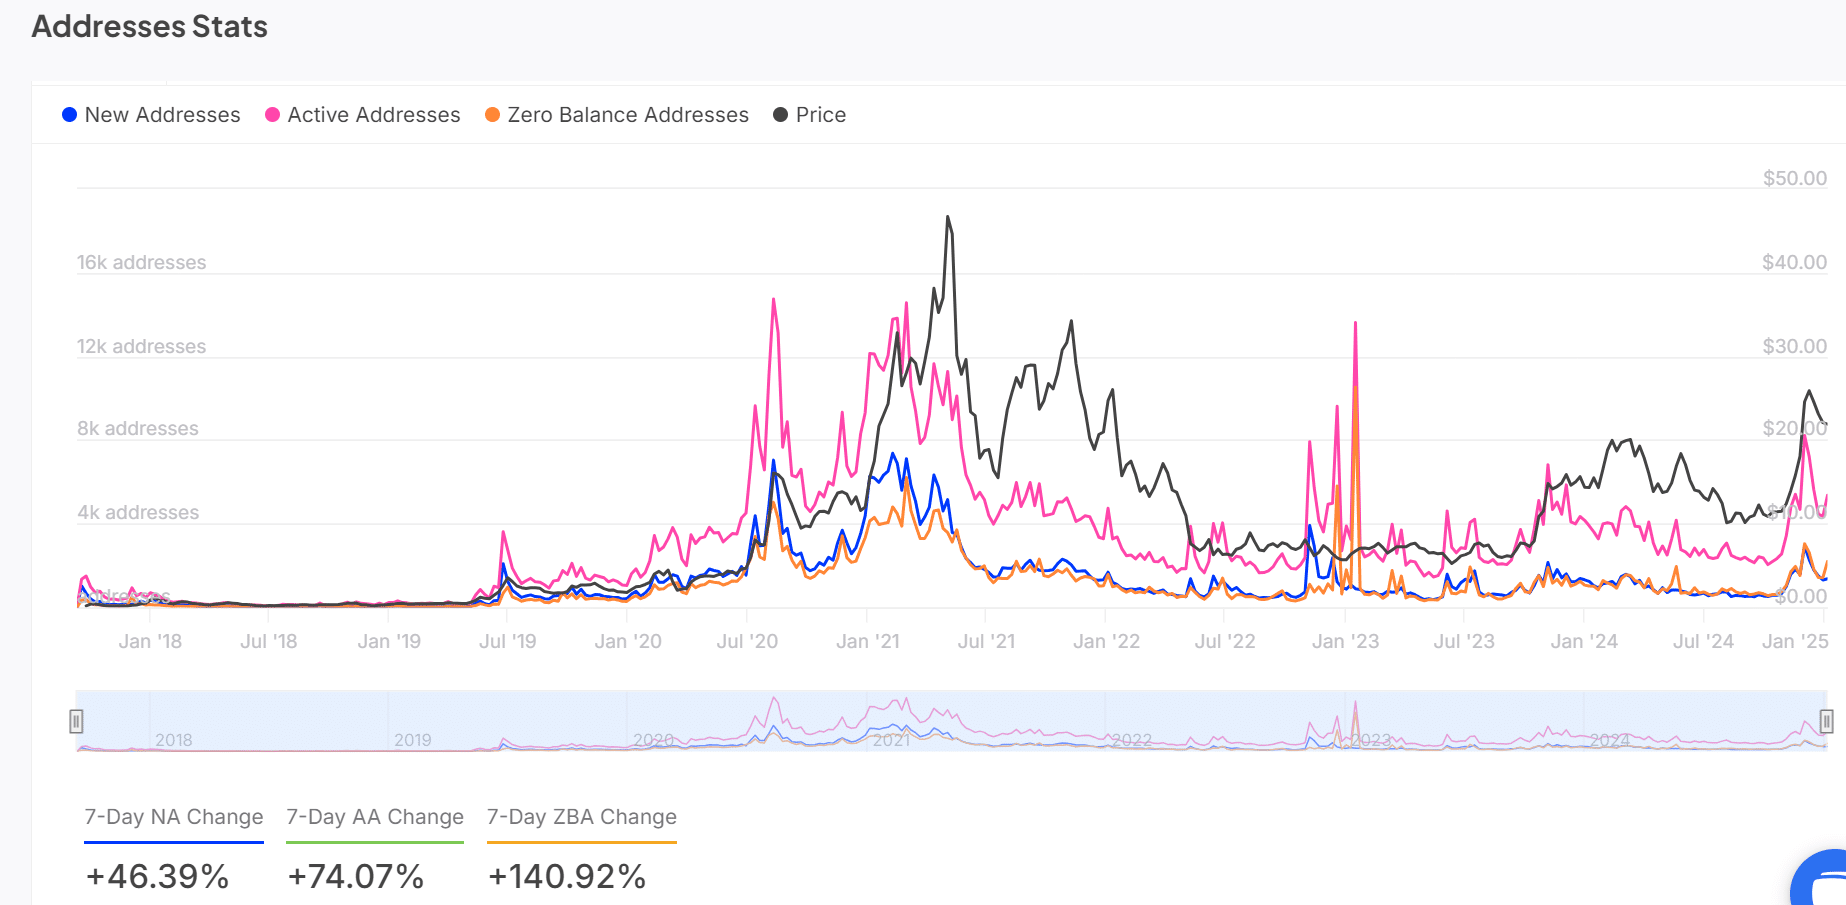
Chainlink address statistical analysis
Recent on-chain data shows increasing activity in the LINK ecosystem, providing a positive outlook for the health of the network.
Over the past seven days, new addresses have surged 46.39% and active addresses have surged 74.07%.
Additionally, zero balance addresses saw a remarkable increase of 140.92%, suggesting renewed interest among previously inactive participants. This increase in engagement reflects growing trust in LINK’s utility.
However, continued growth in these areas is essential to maintain long-term network strength and price stability.


Source: IntoTheBlock
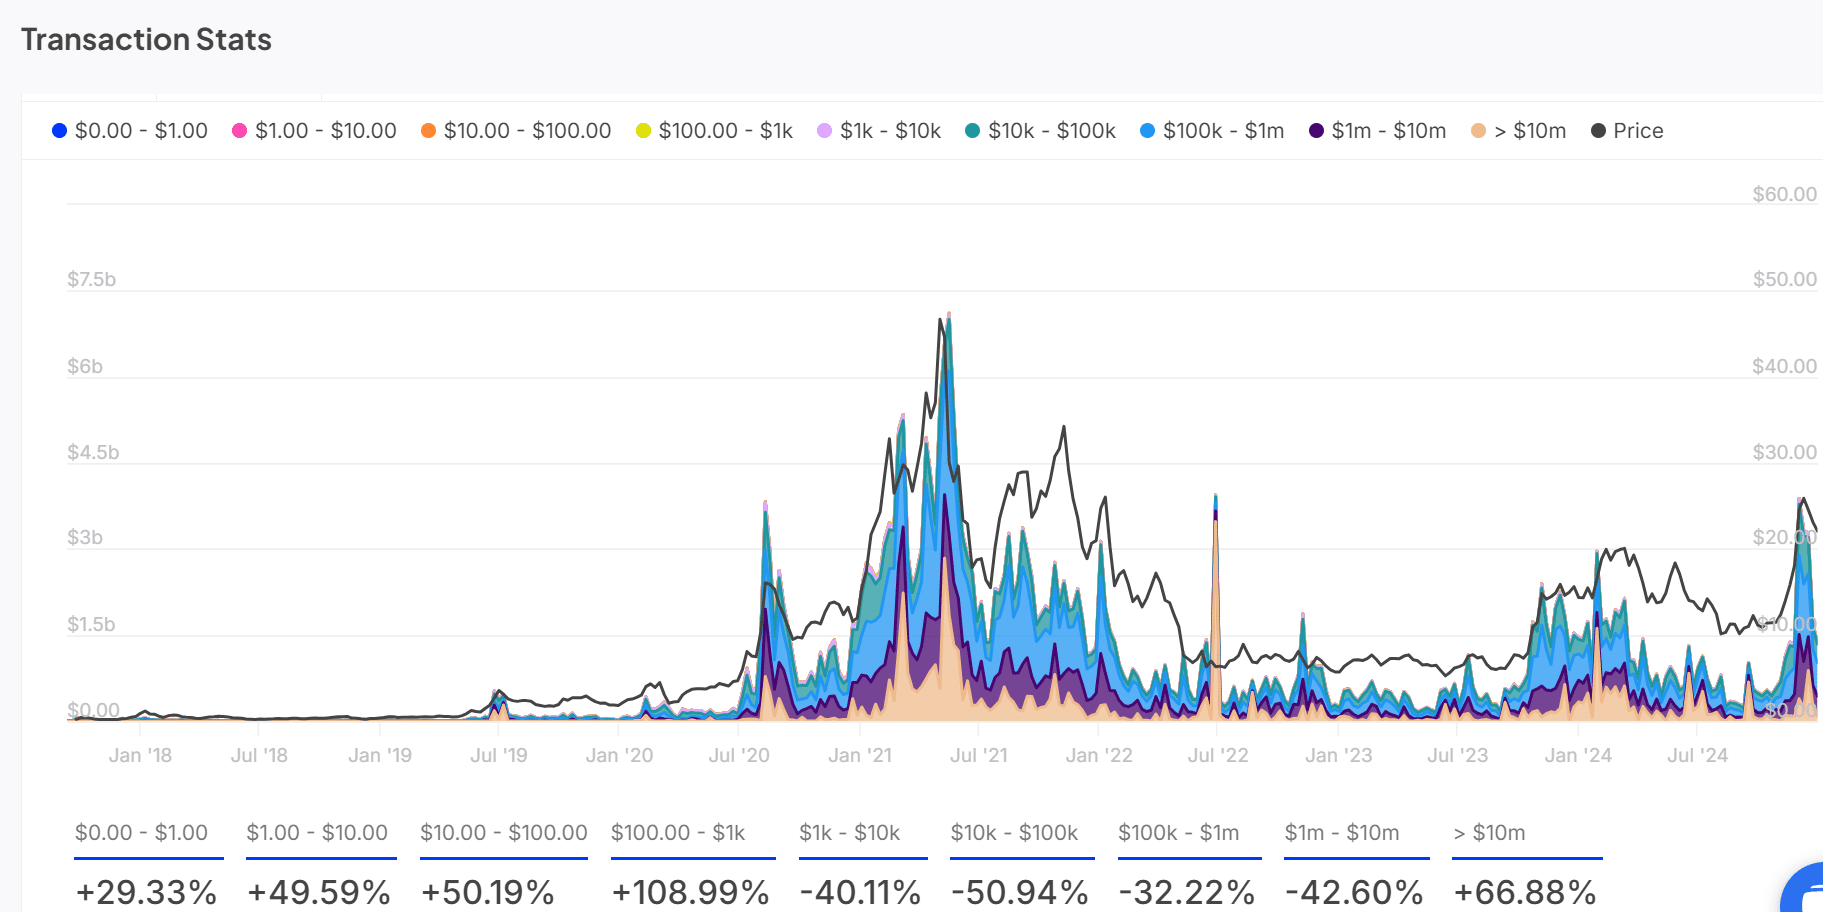
Trading volume trends by size
Volume data indicated mixed feelings among investors. Smaller transactions between $10 and $100 increased by 50.19%, while larger transactions exceeding $10 million saw an impressive increase of 66.88%.
This signals the confidence of both individual and institutional investors.
However, mid-size transactions, especially those in the $1,000 to $100,000 range, have declined significantly. This signals hesitation among certain investor groups and highlights the need for clarity on LINK’s price movements.
Maintaining momentum will therefore be critical to restoring broader investor confidence.


Source: IntotheBlock
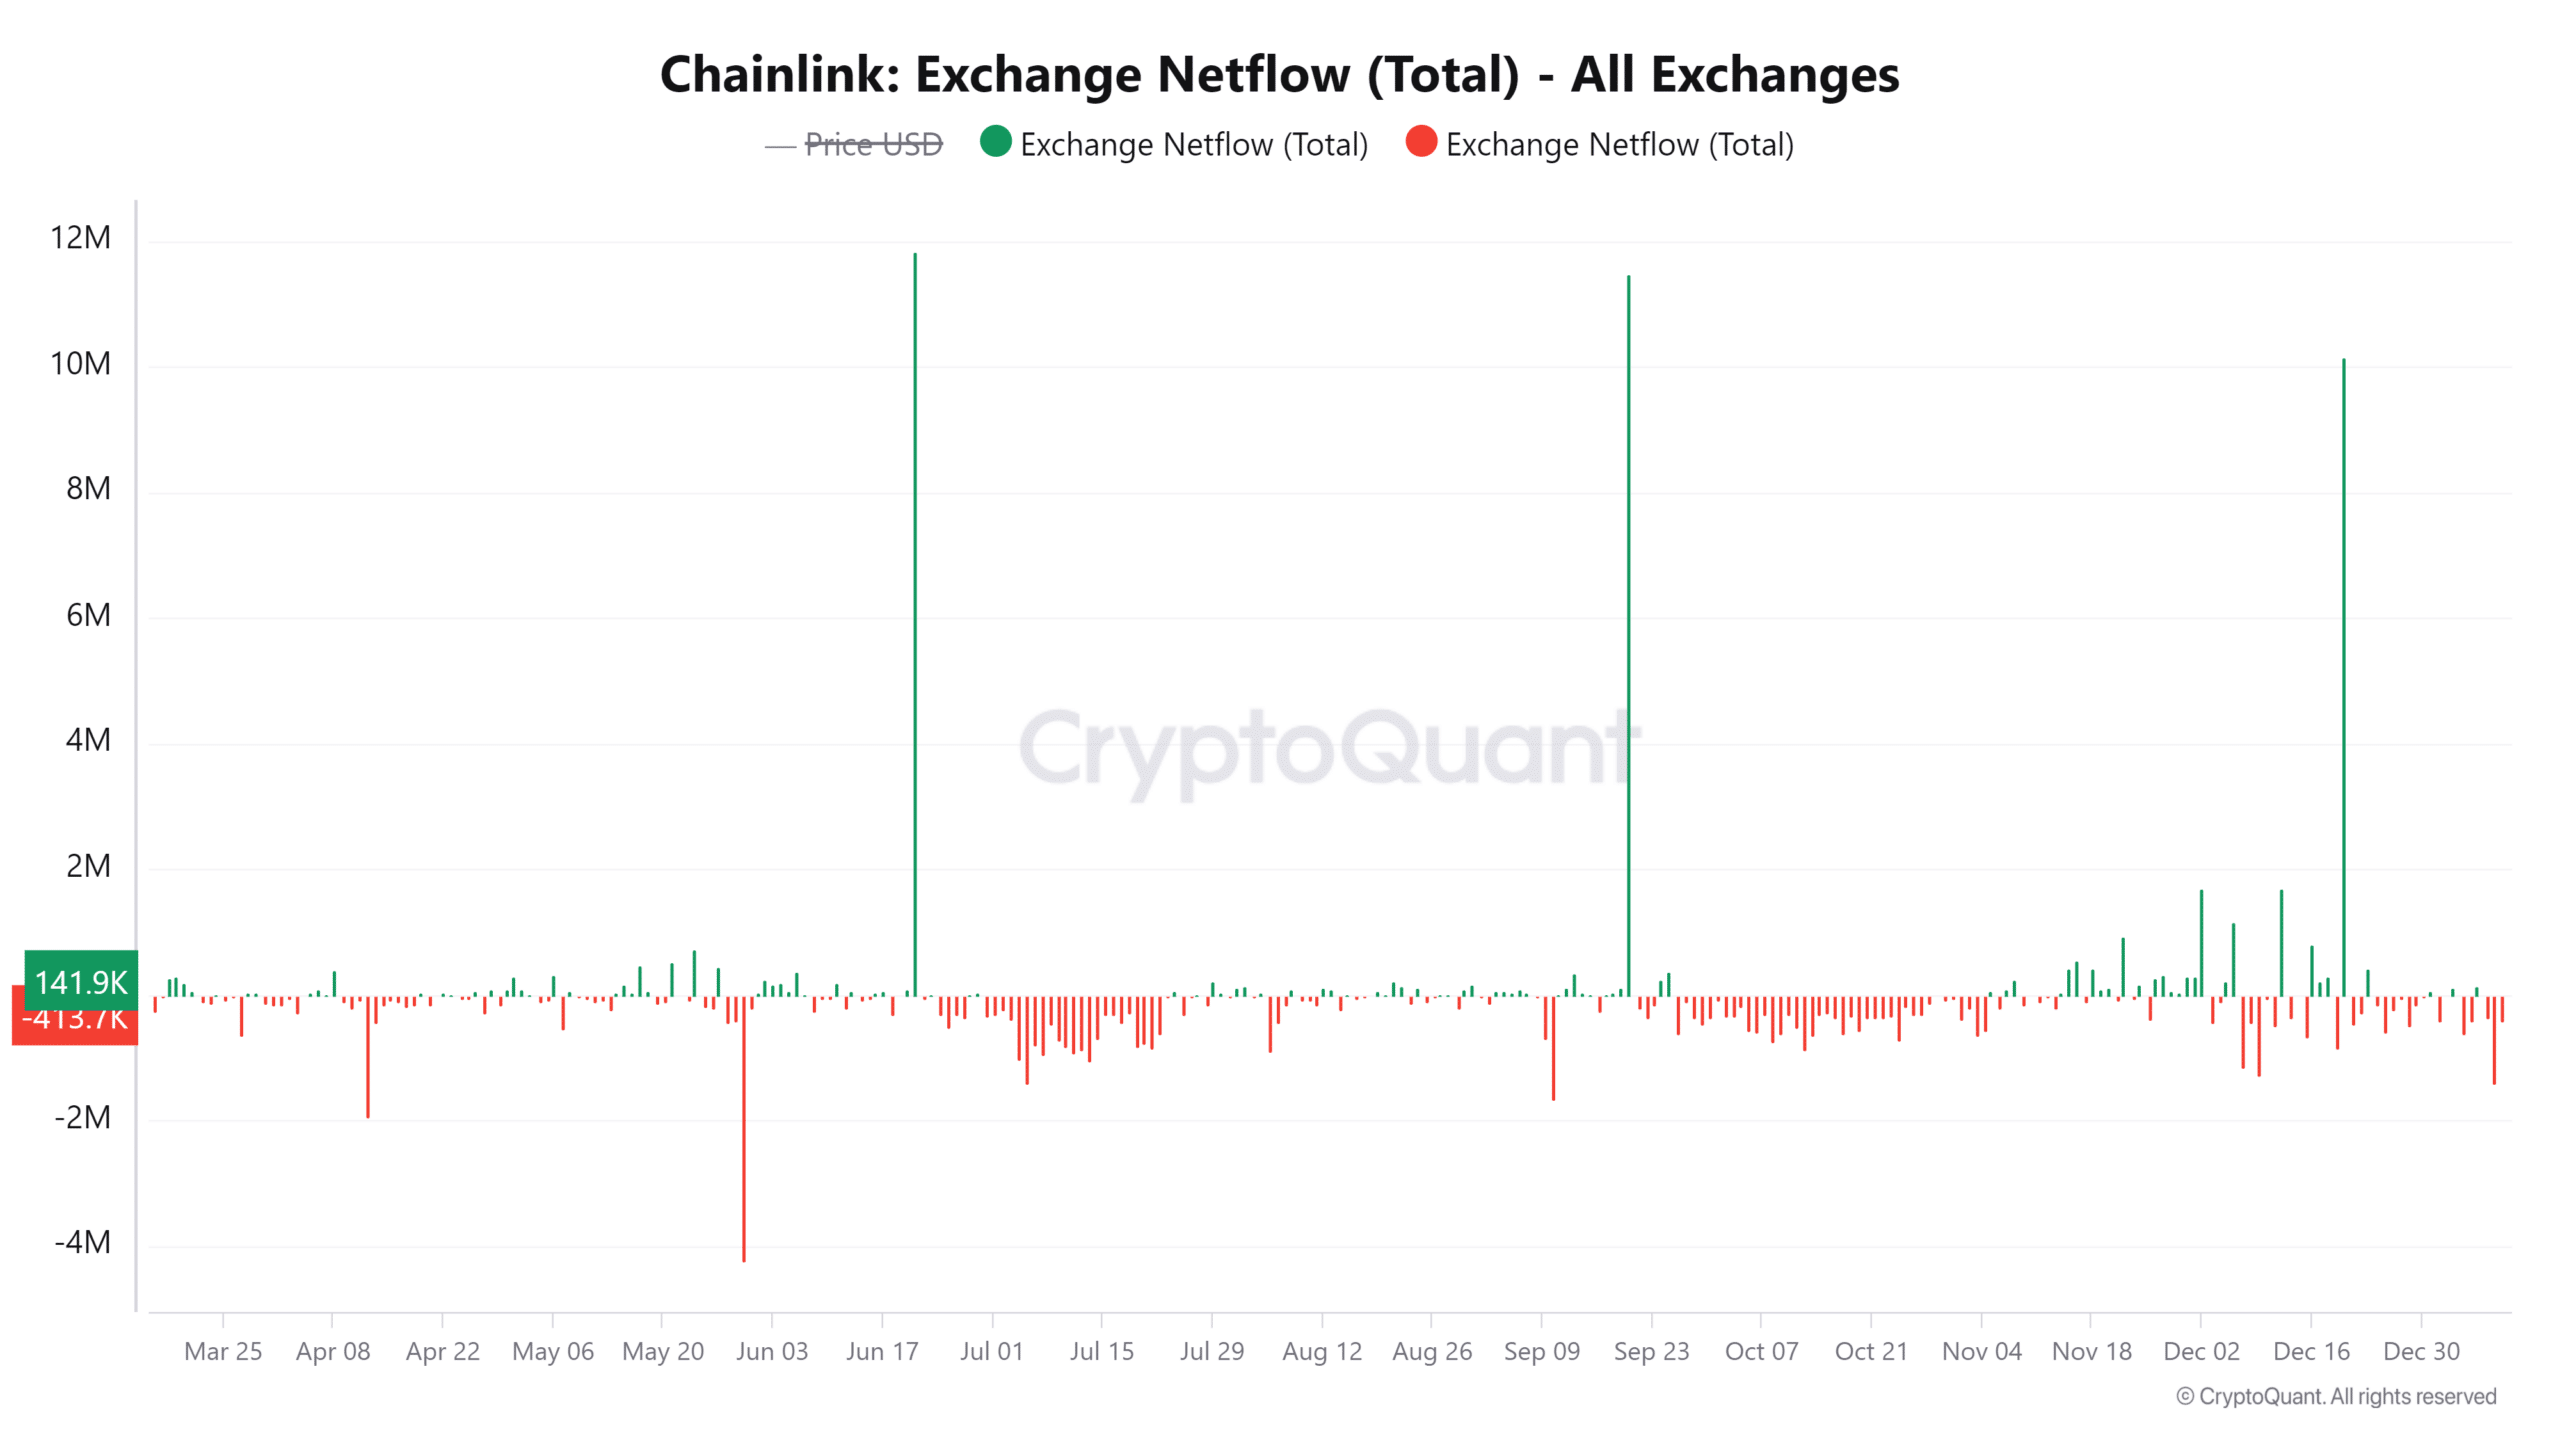
Exchange netflow: what does it signal?
Exchange netflow data shows that outflow dominance has increased by 3.79% in the last 24 hours. This indicates reduced selling pressure in line with a potential accumulation trend.
Historically, these trends have often preceded bullish price movements. However, sustained outflows are needed to confirm this pattern and drive LINK’s price higher.


Source: CryptoQuant
Is your portfolio green? Check out the LINK Profit Calculator
Conclusion: Is there a chance of a breakthrough?
Considering the technical setup, increasing address activity, and net outflows, LINK is well-positioned for a breakout once the $23.92 resistance is cleared.
A bounce towards $32 is possible, but maintaining the demand zone is important to maintain upward momentum. Therefore, LINK appears poised for growth if the market supports a bullish breakout.

