
 break the 0 Fibonacci barrier?")
Four months ago, NVIDIA (NVDA) stock price fell short of $500. Currently, Nvidia’s price is once again rebounding towards this important level.
The important question now is whether Nvidia’s stock price will successfully surpass the important Fibonacci (Fib) resistance near the $500 level. This level is very important as a successful violation can indicate strong bullish momentum. On the other hand, there is a possibility of another bearish rejection at this threshold, which could lead to a decline or consolidation in the stock price.
Is Nvidia ready to break the $493 Fibonacci resistance?
If Nvidia’s stock price successfully overcomes the Fibonacci (Fib) resistance level around $493, it has the potential to surpass its previous high of around $505.
However, technical indicators offer a mixed picture. The Moving Average Convergence Divergence (MACD) histogram has been trending downward into a bearish pattern over the past four months, but the MACD line is still in a bullish crossover. Importantly, the Relative Strength Index (RSI) is showing significant bearish divergence. This is a signal reflected in the stock’s performance four months ago.
During September and October, Nvidia’s stock price fell about 21%. It then found support in the $403-$410 range, leading to a bounce in the price back to the Fib resistance around $493.
If Nvidia breaks this resistance level with bullish momentum, the stock could be poised to hit a new all-time high. This assumes market conditions and company fundamentals remain favorable. This scenario highlights the dynamic nature of stock market movements. It is influenced by a mix of technical indicators and broader market factors.
Nvidia’s weekly chart shows a bearish divergence in RSI.
Nvidia’s weekly chart has a mix of bullish and bearish signals. On the bearish side, the Moving Average Convergence Divergence (MACD) line is at a bearish crossover and the Relative Strength Index (RSI) indicates a bearish divergence.
But there are also positive indicators. In particular, the MACD histogram has started showing strength since last week, and the exponential moving average (EMA) is showing a golden crossover. These signals suggest that Nvidia’s mid-term trend remains strong.
If Nvidia faces bearish rejection at the Fibonacci (Fib) resistance just below $500 and subsequently breaks through the support zone between around $403 and $410, it could find the next important support at the 50-week EMA around $378.
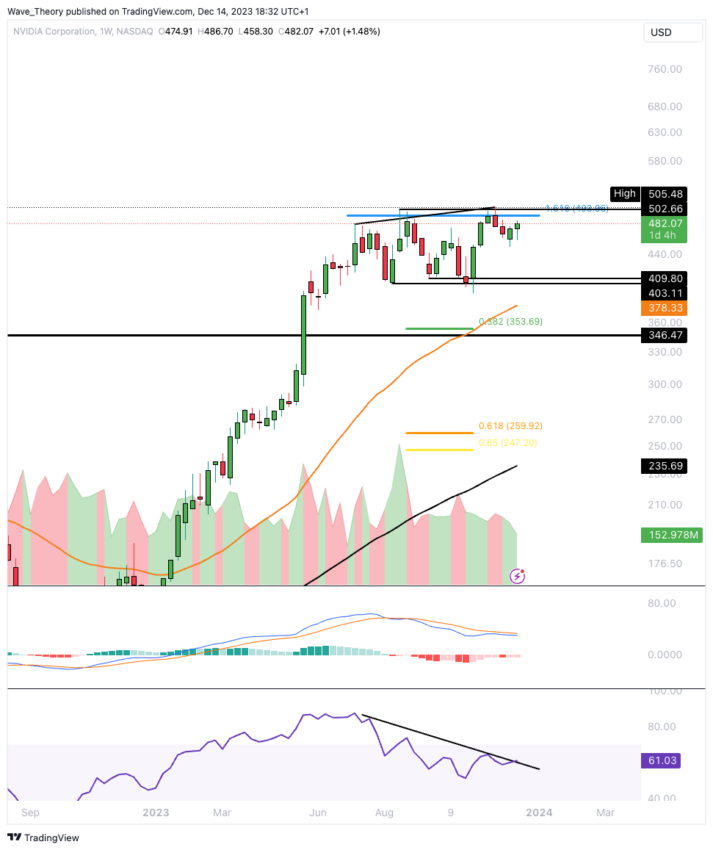
If the price falls further, the next notable Fib support level is expected to be around $354, or more materially around $255. This level could be a critical point for a potential rebound or further price correction.
Nvidia daily chart shows emerging bullish price pattern
On Nvidia’s daily chart, technical indicators primarily indicate bullish momentum. The Relative Strength Index (RSI) is neutral and indicates balanced market conditions with no strong overbought or oversold signals. The Moving Average Convergence Divergence (MACD) line is approaching a bullish intersection. The MACD histogram is trending upward, both indicating potential bullish momentum.
Read more: 9 Best AI Cryptocurrency Trading Bots to Maximize Your Profits
Additionally, the golden crossover of the exponential moving average (EMA) further confirms the bullish trend in the short and medium term. These crossovers occur when a short-term EMA (such as the 50-day EMA) crosses a long-term EMA (such as the 200-day EMA). This is often interpreted as a bullish signal.
An interesting development on the daily charts is the emergence of a bullish price pattern. To be more specific, it is a ‘reverse head and shoulders’ pattern. This pattern is generally considered a bullish reversal indicator. If Nvidia’s stock price rises above $540, there could be a bullish sign from this pattern. This could potentially lead to further increases in prices.
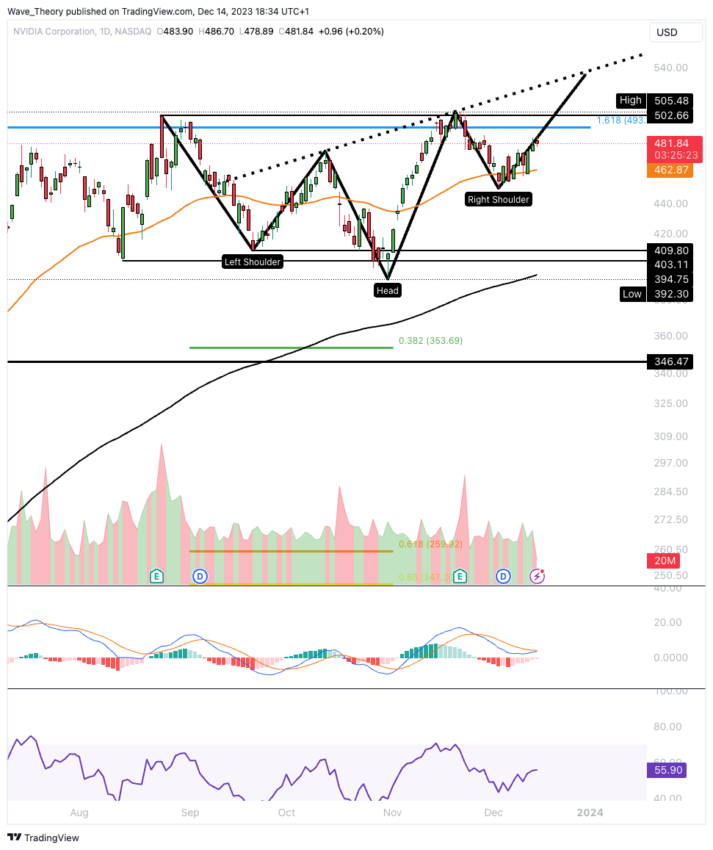
The inverse head and shoulders pattern combined with other bullish indicators suggests a favorable outlook for Nvidia in the short to medium term. However, this will depend on the stock’s ability to break the key price level of $540.
Nvidia’s 4H chart analysis: Indicators indicate a bullish trend.
On Nvidia’s 4-hourly (4H) chart, the trend is predominantly bullish, as evidenced by several key indicators. The golden crossover of the exponential moving average (EMA) is an important bullish signal. These crossovers occur when a short-term EMA (such as the 50-day EMA) crosses a long-term EMA (such as the 200-day EMA) and indicate upward momentum.
Additionally, the Moving Average Convergence Divergence (MACD) histogram is showing an upward trend. It also indicates that bullish momentum is increasing, and the MACD line is in a bullish crossover, reinforcing this positive trend.
Read more: Top 9 Cryptocurrency-related Telegram Channels in 2023
On the other hand, the Relative Strength Index (RSI) is in the neutral zone. This neutrality represents balance in the market. However, there are no strong overbought or oversold conditions and it does not currently provide any clear bullish or bearish signals.
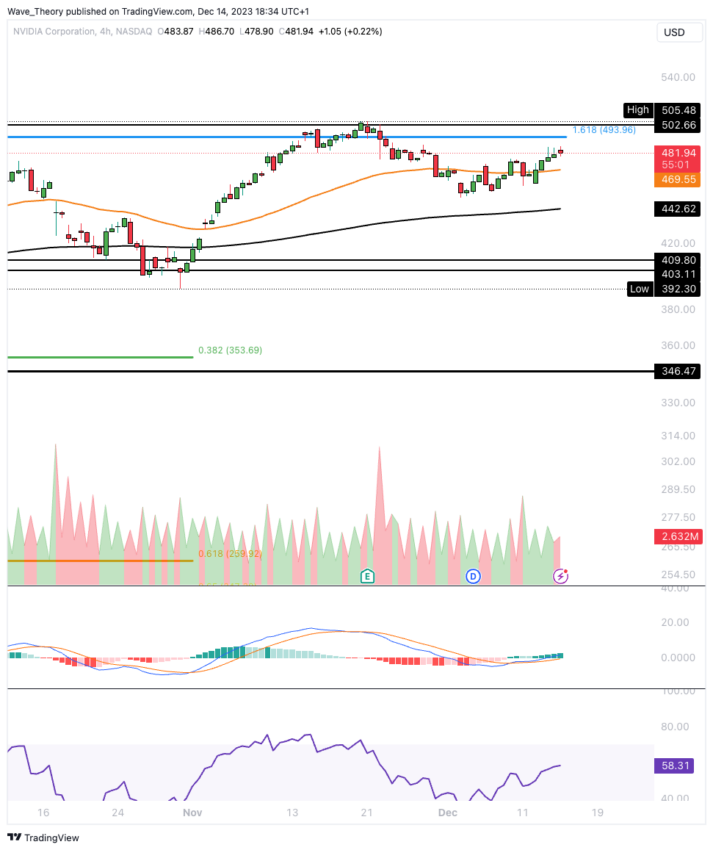
Overall, the golden crossover of the bullish MACD and EMA along with the neutral RSI suggests a generally bullish outlook on Nvidia’s 4H chart, suggesting a favorable near-term trend.
Observation of upward correlation between Bitcoin and NVIDIA
The correlation between Bitcoin and Nvidia stock is currently moderate, but has increased noticeably in recent weeks. It is currently around 0.47 level. This positive correlation coefficient indicates that the price movements of Bitcoin and Nvidia were somewhat consistent. Both are moving in somewhat similar directions.
It is important to note that a correlation coefficient of 0.47, while significant, does not imply a very strong relationship. This suggests that there is some level of synchronization in price movements. However, they are not very dependent on each other.
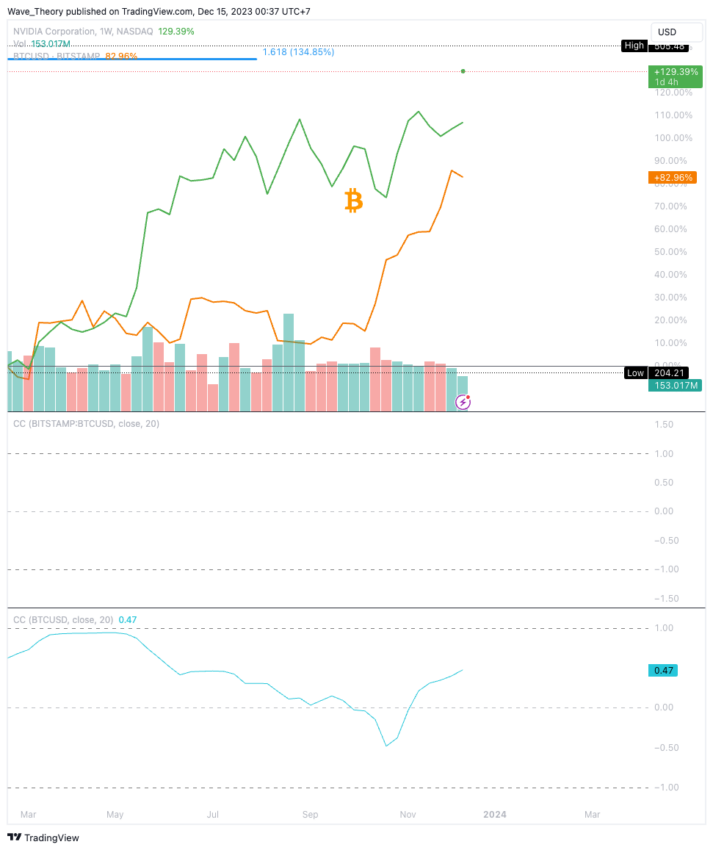
There have been times in history when the correlation between Bitcoin and Nvidia has been more pronounced. This strong correlation in the past can be attributed to a variety of factors, including market sentiment, technological developments, or investment patterns that have linked the performance of the cryptocurrency market, particularly Bitcoin, with technology stocks such as Nvidia.
However, correlation levels can fluctuate over time due to changes in market dynamics, economic conditions, and investor behavior.
Read more: Best Cryptocurrency Signup Bonuses of 2023
disclaimer
In accordance with Trust Project guidelines, this price analysis article is provided for informational purposes only and should not be considered financial or investment advice. BeInCrypto is committed to accurate and unbiased reporting, but market conditions may change without notice. Always do your own research and consult with a professional before making any financial decisions.