Market Outlook #247 (28th November 2023)
Hello, and welcome to the 247th instalment of my Market Outlook.
In this week’s post, I will be covering Bitcoin, Ethereum, Polkadot, Cosmos Hub, Aave, Akash Network, Litentry and Rainicorn.
As ever, if you have any requests for next week, send them across.
Bitcoin:
Weekly:
Daily:
Price: $37,295
Market Cap: $729.275bn
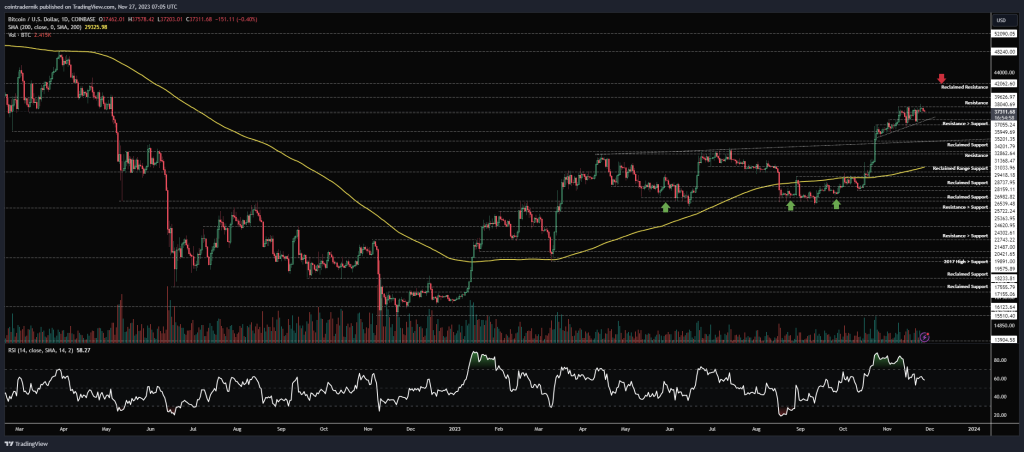
Thoughts: If we begin by looking at BTC/USD on the weekly timeframe, we can see that price – despite wicking lower earlier in the week – formed a higher-low above the prior week and closed at marginal new yearly highs on growing volume. We closed just above prior support at $37.1k but remain capped by $38k for the time being. It looks almost like something of an ascending triangle is now forming with $38k as the resistance; and as long as we hold above $36k as support this week I think it is likely we see an upside resolution and push up into $39.6k, followed by $42k as the major level. Naturally, a weekly close below $36k would invalidate this structure and we could then consider a deeper pull-back, but for now all signs point north, in my view.
Turning to the daily, we can see this ascending triangle formation a little more clearly, with a failed breakout attempt above resistance a couple of days ago but a lack of willingness to push any lower at present. Whilst we continue to hold this trendline and prior resistance turned support around $36k, I think it is likely we continue to push higher, particularly if $37k now begins to act as support as it currently appears to be doing. Watching for a daily close firmly through $38k to act as the catalyst for the next leg higher. Nothing much else to discuss here for now.
Ethereum:
ETH/USD
Weekly:
Daily:
ETH/BTC
Weekly:

Daily:

Price: $2045 (0.05487 BTC)
Market Cap: $245.906bn
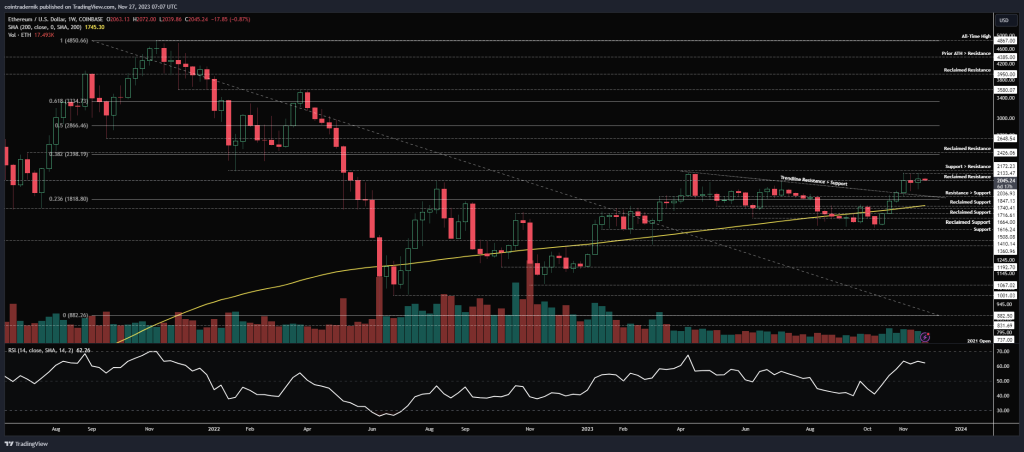
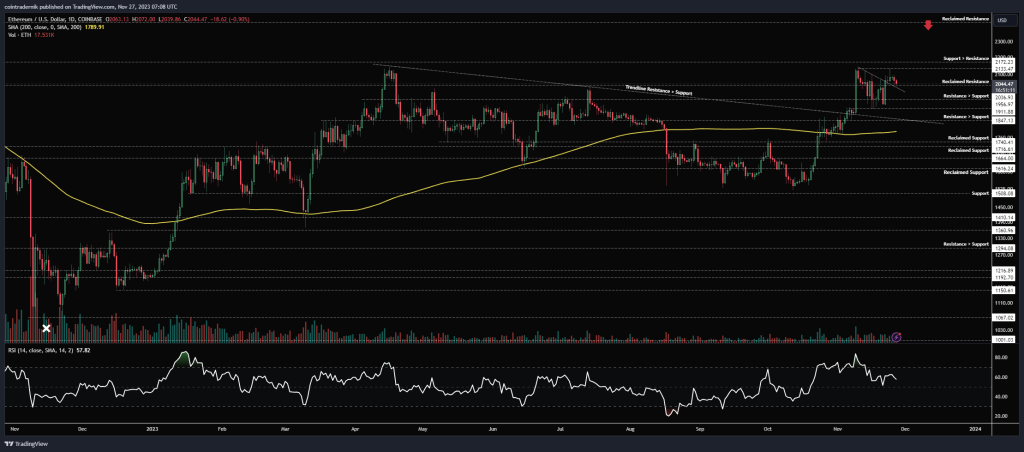
Thoughts: Another week goes by for ETH/USD and we remain consolidating right around that $2037 level. Last week saw price form a higher-low above the prior week’s low but continue to be capped by $2133 as resistance. Whilst we are continuing to chop around at this level but hold above prior trendline resistance, much like BTC I expect we see upside resolution of this range and any move through $2170 opens up that $250 range into the next resistance area at $2426. Dropping into the daily, we can see that price is now retesting $2037, which could become resistance turned support here if it holds – if not we’re looking at reclaimed resistance and likely another move lower into $1957 as the next major support. However, we are also testing minor trendline resistance as support here too, providing confluence for a possible bottom early this week in this area. If that occurs and we start to push higher off this trendline, I think $2133 gets blown out later this week, and then we’re looking for a weekly close above $2172 for continuation higher in December.
Turning to ETH/BTC, more consolidation followed last week below that 200wMA and range low at 0.055, but price held once again above 0.0533 as support. Whilst we’re in this range, there honestly is not a lot more to add to last week’s analysis: weekly close back above that 200wMA and bottom is likely in, at least for a push into trendline resistance; but close below 0.0533 and I think we take out 0.051 into 0.0487. Let’s see if we get any real movement this week…
Polkadot:
DOT/USD
Weekly:

Daily:

DOT/BTC
Weekly:
Daily:
Price: $5.25 (14,077 satoshis)
Market Cap: $6.825bn
Thoughts: Beginning with DOT/USD, we can see that price has been consolidating after its strong move off the lows and through trendline resistance, rejecting below prior support at $6 but holding now above $5 as reclaimed support. This $5-6 range is very much just consolidation post-trendline breakout, so as long as we now hold above $4.40 I think we’re looking at a move into $7.08 sooner rather than later, where there is stronger resistance. Weekly close through that is what bulls want to see for the next large range to open up, with $10-11 the resistance area I’d expect to see tested once $7 becomes support. Dropping into the daily, we can see how the 200dMA is now acting as support around $5.27, aligning with reclaimed support in that area; we’re effectively bull-flagging into that level as support, which is promising. Either a higher-low above it or a sweep of that level with some divergence would be the perfect setup for a long entry, with a view to hold for a breakout above $6, looking at $7 as the primary target.
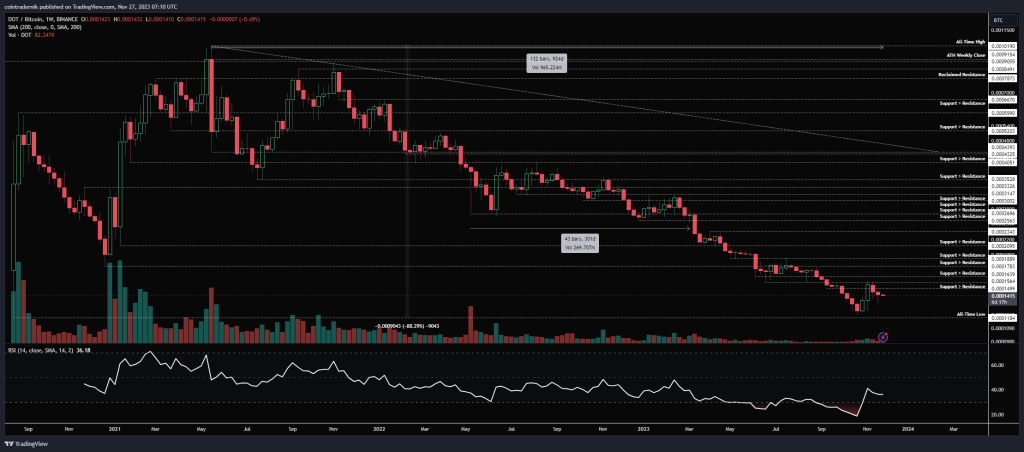
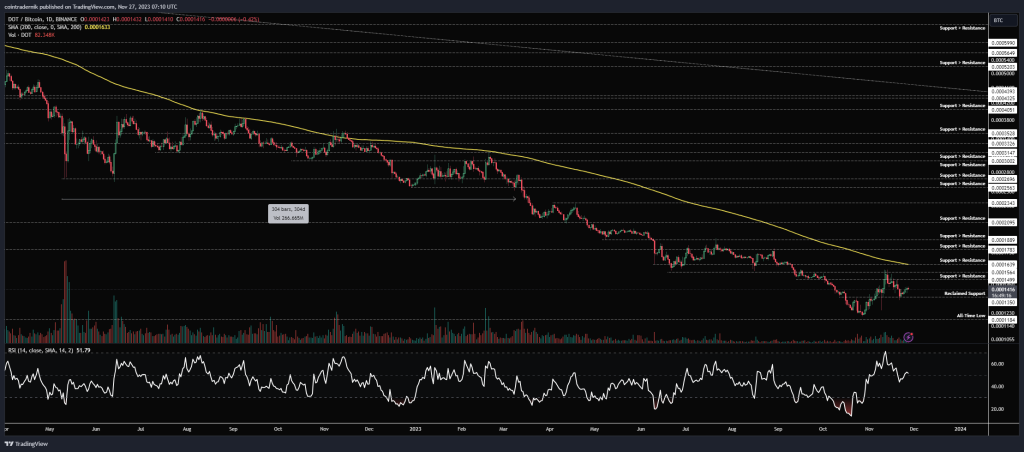
Turning now to DOT/BTC, we can see that price rejected at prior support ~15.6k satoshis and is now forming a higher-low above the October lows and all-time low at 11.8k satoshis. We are still very much in a bear trend here, with bearish market structure on the weekly, but, if we drop into the daily, we can see signs of a shift here, as price reclaimed support at 13.5k satoshis and has formed a higher-low there. Nonetheless, whilst this is below below the 200dMA (as it has been for well over 18 months) and 16.4k satoshis, it is safer to assume the downtrend persists, but given how the broader market looks at present I would not be surprised to see that confluence of resistance cleared in December, turning market structure bullish on the higher timeframes. If we see that, we can look at long exposure on DOT in mid-Dec-January for some catch-up moves.
Cosmos Hub:
ATOM/USD
Weekly:

Daily:

ATOM/BTC
Weekly:

Daily:

Price: $9.45 (25,352 satoshis)
Market Cap: $2.765bn
Thoughts: Beginning with ATOM/USD, we can see from the weekly that price rallied last week after wicking below support at $9 to close at weekly highs just shy of $10. We are now capped by prior support but this push off support into weekly highs indicates higher prices from here to me, with a move above $10.30 this week opening a huge range to play longs within: we then have only trendline resistance barring the way to the 200wMA up at $13.40, where there a lot of confluence for resistance and thus likely a wise area to hedge long exposure in the coming weeks and months. If we reject $10.30 and start to close back below $9, however, then we can look at a return to $7.30, where I would look for longs above that level forming a higher-low. Briefly looking at the daily, we can see that price bounced off the 200dMA as support and reclaimed $9 subsequently, having reset momentum indicators and thus now looking primed for continuation through $10. Let’s see what the week brings to Cosmos…
Turning to ATOM/BTC, we have a really nice formation here following a deviation below multi-year support at 24k satoshis, with price since consolidating back above the level after a sharp reversal and last week wicking back below the level only to close above 26k satoshis. As long as this support continues to hold now, it is likely the bottom is in and we can expect any move through 27k satoshis to lead to a much sharper rally into that trendline from the September 2022 highs. Below 24k, however, the downtrend resumes, and we can look at 17.8k below as major support. If we look at the daily, we can see the pair continues to be capped by the 200dMA, so acceptance through that would also look very much positive for a longer-term reversal.
Aave:
AAVE/USD
Weekly:

Daily:

AAVE/BTC
Weekly:

Daily:

Price: $95.60 (0.00256 BTC)
Market Cap: $1.396bn
Thoughts: If we begin with AAVE/USD, we can see that the pair has been range-bound for 567 days, with support at $49 and range resistance around $113, all of this price-action having also occurred below the 200wMA. AAVE was also one of the first tokens to peak in 2021, and thus it has been almost three years since those all-time highs formed against the Dollar. We are now pressing up against the top of the range once again, with resistance at $90 now acting as minor support and price sandwiched between there and $113. Now, given how this area of the range has acted as resistance for 18 months, I would not personally look for fresh long exposure around here; rather, I would look for a weekly close above $113 and then look to enter on a retest of range resistance as support, if that opportunity presents itself, with invalidation below $90 and looking for $167 as a first target, followed by the 23.6% fib retracement of the bear market at $207. If we lose $90 here before a breakout, I would look for any opportunity to get long close to $62.
Turning to AAVE/BTC, we can see that price is consolidating within a significant historical range, with support at 22.5k satoshis and resistance at the 2018 cycle highs of 28.5k satoshis. We are also seeing price capped by trendline resistance from October 2021. What bulls want to see from AAVE here is quite clear: a weekly close through both trendline resistance and 28.5k, accepting above both and flipping them into support. If we see that occur, I would be confident that a bottom has formed for this cycle and we’d be looking at the next bull cycle for AAVE, with the 47-55k area as the first major target for upside.
Akash Network:
AKT/USD
Weekly:

Daily:

AKT/BTC
Weekly:

Daily:
Price: $1.64 (4385 satoshis)
Market Cap: $363.597mn
Thoughts: Beginning with AKT/USD, we can see from the weekly that price is in a strong uptrend, turning prior resistance into support on growing volume and now finding some resistance at the 23.6% fib level and prior support at $2. This is textbook price-action so far since bottoming, and I would expect to see reclaimed support at $1.37 now hold as a higher low and price then continue to push into $2.67 as the next resistance. I am personally not looking to sell any of my AKT until we get closer to $4, however, with a view to hold at least 20% of my original position for fresh all-time highs above $8. Nothing else to add here as this is very clean market structure.
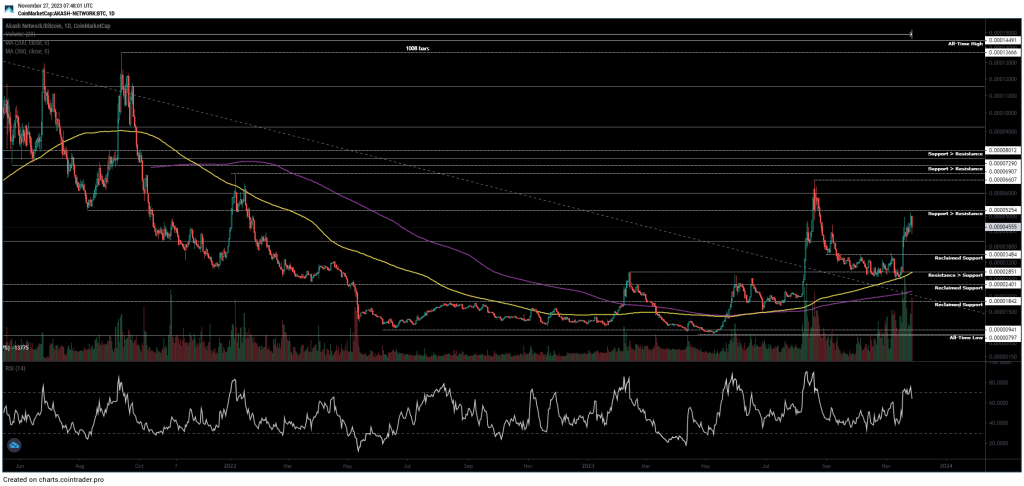
Turning now to AKT/BTC, we can see how price rejected 6640 on the first attempt back in August and closed below 5200 satoshis on that attempt, then retracing into 2850 to form a higher low and then reversing on growing volume off that level. Price is now once again sat right below 5200 satoshis, so we are looking for a weekly close above this level to open up the next leg of the cycle, with a retest of 6640 the first level of interest here, given the confluence of resistance in that area. Above 8000 satoshis, there is effectively zero resistance back towards the all-time highs, so that’s where I think we’ll see price accelerate (as market cycles often do). Onwards and upwards in 2024…
Litentry:
LIT/USD
Weekly:

Daily:
LIT/BTC
Weekly:

Daily:

Price: $0.87 (2329 satoshis)
Market Cap: $40.644mn
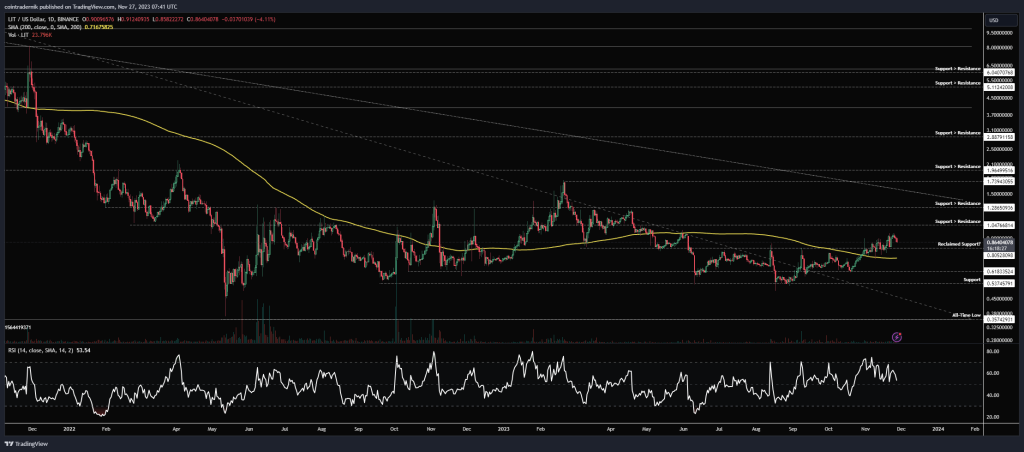
Thoughts: Beginning with LIT/USD, we can see that price has been in a downtrend since incept, trading lower for over 1000 days at this point, but having spent the past year consolidating above all-time lows and above support at $0.54. We have recently turned weekly structure bullish by closing above $0.80 and I have added to my spot bag here around $0.86. I would like to see the pair now push on and close above $1.30 and then overcome that trendline resistance from the all-time high, after which I think we’ll see a disbelief rally kick in and LIT’s first bull cycle begin. I am looking to hold this for the duration of that first market cycle, with fresh all-time highs above $16 the expectation in the next 12-18 months, but with a view to sell partials at $6 and at $12.50.
Turning to LIT/BTC, we can see that the pair has been consolidating between support at 2000 satoshis and resistance at 2850 for 6 months now, holding above all-time lows in the meantime. This diminishing volatility and consolidation range above all-time lows is exactly what I look for in a bottoming formation, providing confluence for adding to my spot bag here. For those with a little less risk appetite, you could await a strong close above 2850 and turning that level into reclaimed support before entry, making it a higher probability that we see continuation higher from there, with 6200 satoshis as the first major resistance above. Little else to discuss for LIT.
Rainicorn:
RAINI/USD
Weekly:

Daily:

RAINI/BTC
Weekly:

Daily:
Price: $0.0244 (65 satoshis)
Market Cap: $11.857mn
Thoughts: Beginning with RAINI/USD, we can see from the weekly that the pair has been reversing sharply for the past few weeks and is now sat in no man’s land between reclaimed support at $0.016 and support turned resistance at $0.04, above which the 2023 high is also sat at $0.05. I expect this momentum – and the momentum in the broader market for the BEAM ecosystem – to continue, taking this into $0.04 with haste. What we then want to see is the formation of a higher-low and then a weekly close through the 2023 highs and the 23.6% fib retracement at $0.05. That’ll be the catalyst for the next phase of RAINI’s bull cycle, as we emerge from disbelief. I am expecting to see $0.088 hit later this year and then price to accelerate towards fresh all-time highs later in 2024 after some sort of longer consolidation period.
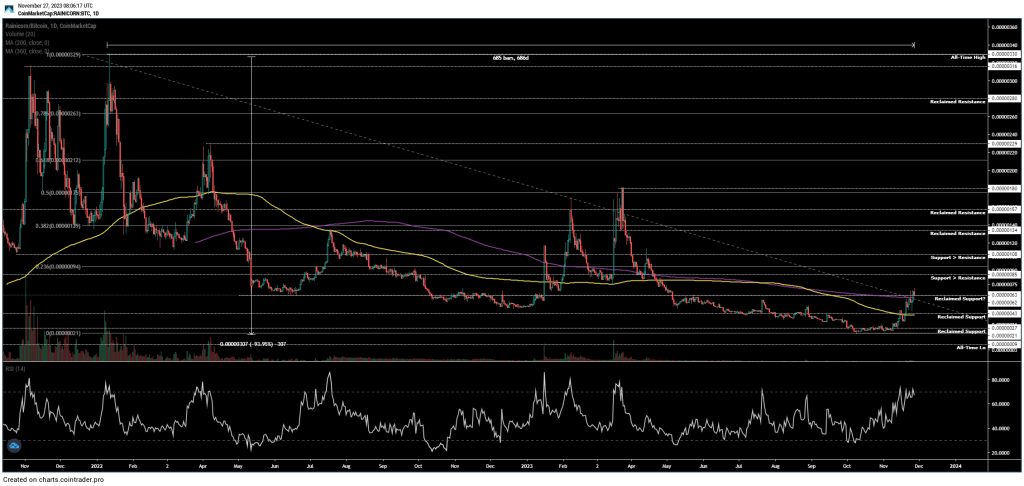
Turning to RAINI/BTC, we can see how the pair has turned weekly structure bullish and has reclaimed support at 62 satoshis, with 43 satoshis acting as reclaimed support last week. There is air between here at 85 satoshis, which is then next level I expect to see hit in the next week or two, but truly I don’t see much by way of major resistance until 108 satoshis. That’s where I would expect the pair to take a breather before making a move for that 38.2% retracement level and historical resistance at 134 satoshis. If you’re looking for an entry, I’m not sure we get a sharp pull-back down here but obviously 43 satoshis would be golden, or anything close to that. Looking ahead into 2024, I am expecting any acceptance above the 2023 highs at 180 to begin the parabolic phase of its bull cycle, with 280 as major resistance above that (where I will likely sell some RAINI) and fresh all-time highs beyond that at 330.
And that concludes this week’s Market Outlook.
I hope you’ve found value in the read and thank you for supporting my work!
As ever, feel free to leave any comments or questions below, or email me directly at nik@altcointradershandbook.com.

