

Bitcoin (BTC) has rebounded more than 28% from its February low of $60,000, with mixed technical, liquidity, and on-chain signals suggesting a recovery may still be underway.
BTC/USD daily chart. Source: TradingView
Key Takeaways:
- Bitcoin has a support zone that previously triggered an 8% to 10% rally.
- Binance Stablecoin inflows are increasing, bringing new distributable liquidity to the cryptocurrency market.
BTC hit support with an 8% to 10% rebound.
Since early April, Bitcoin has been trading within a well-defined upward channel and the price has consistently respected both rising support and resistance trend lines.
Each test of the lower limit triggered rallies of 8% to 10%, often pushing BTC back to the upper trendline or even beyond it. Current settings reflect previous cycles.
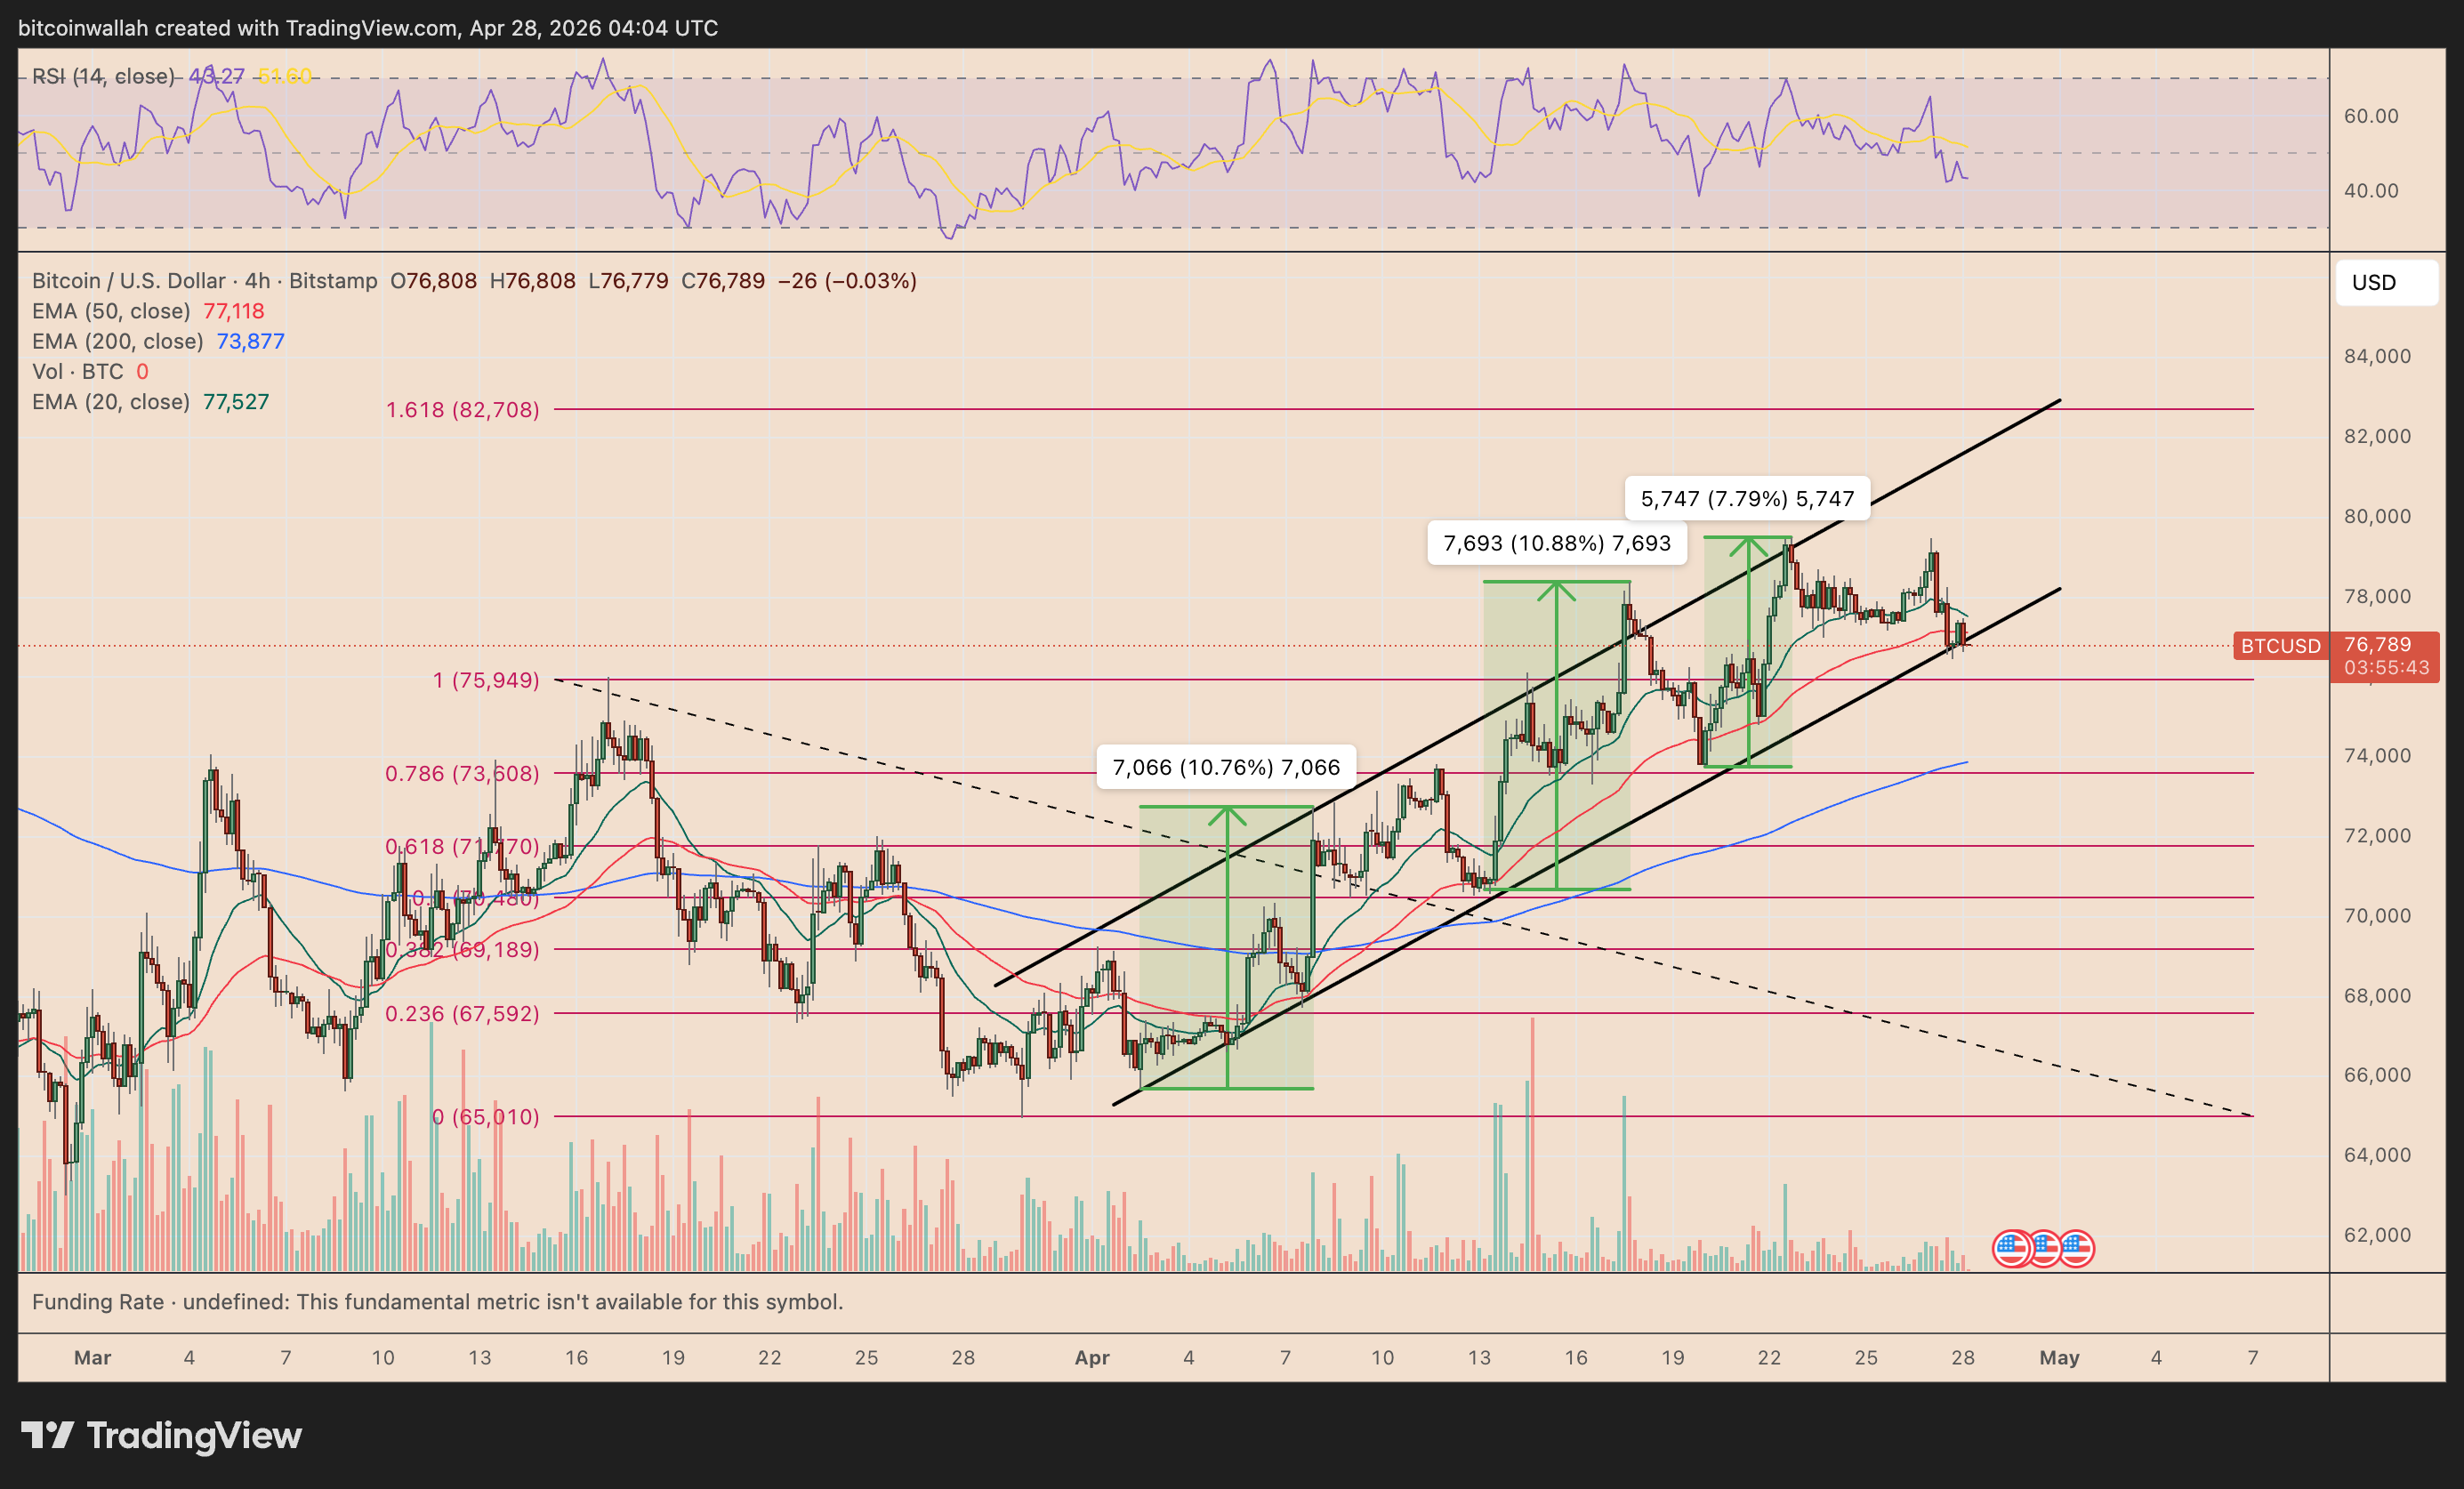
BTC/USD 4-hour chart. Source: TradingView
BTC is currently consolidating near the lower channel support around $76,800-$77,500, which is also consistent with the 20-day (green) and 50-day EMA (red) on the 4-hour chart, which are key dynamic support levels for the ongoing uptrend.
A bounce from this range increases the odds of BTC price reaching an upper limit near $82,700, approximately 7.70% above the current price. This level coincides with the 1.618 Fibonacci retracement level.
relevant: Bitcoin shorting creates $1.4 billion in liquidation risk. Will the price be squeezed to $80,000 next?
Conversely, a break would risk pushing BTC price down to $73,600, a level consistent with the 0.786 Fib line and the 200-4H EMA (blue).
Binance’s stablecoin inflows have increased the potential for a BTC rally.
Liquidity conditions will also improve, resulting in improved technical settings.
Binance recorded nearly $6 billion in stablecoin inflows in March and April, including $3.5 billion in April alone, a sharp reversal from the previous net outflow of $7.6 billion, CryptoQuant data shows.
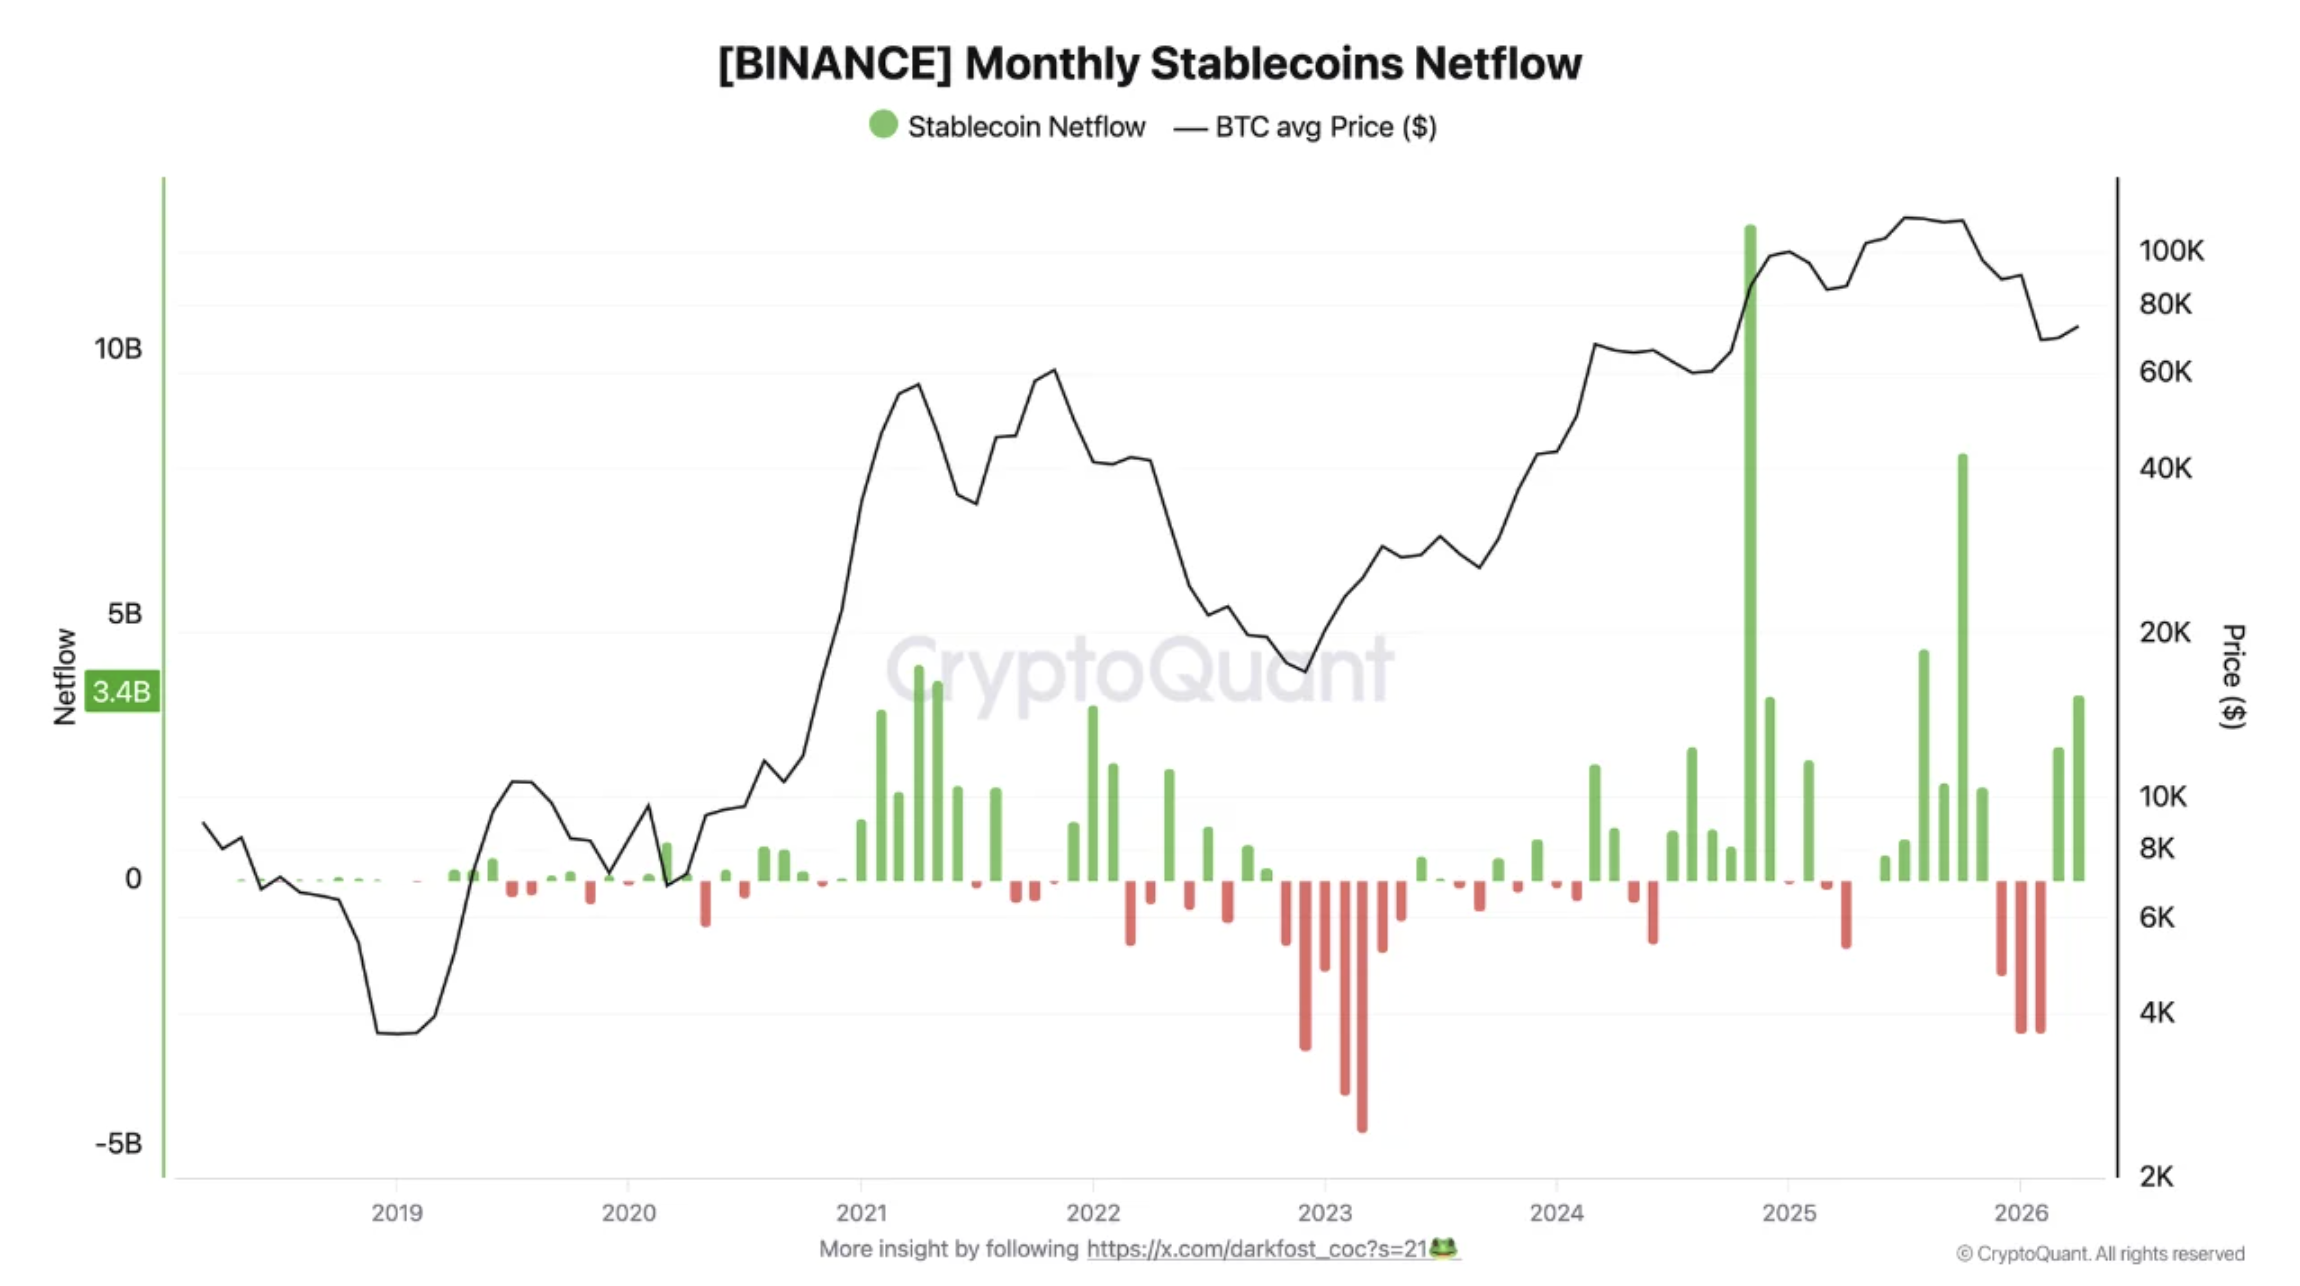
Binance’s monthly stablecoin netflow. Source: CryptoQuant
This is important for bulls because stablecoin inflows represent deployable capital. That said, liquidity is returning to exchanges, suggesting traders are preparing to re-enter risk despite US-Iran tensions and rising oil prices.
Bitcoin MVRV Fractal Hints Uptrend Above $92,000
Bitcoin’s recent rebound has pushed the price back above the MVRV -0.5 standard deviation band (green), around $72,750. These bands have often served as support and resistance levels in previous market cycles.
MVRV bands measure how far the Bitcoin spot price has moved from an investor’s total on-chain cost basis.
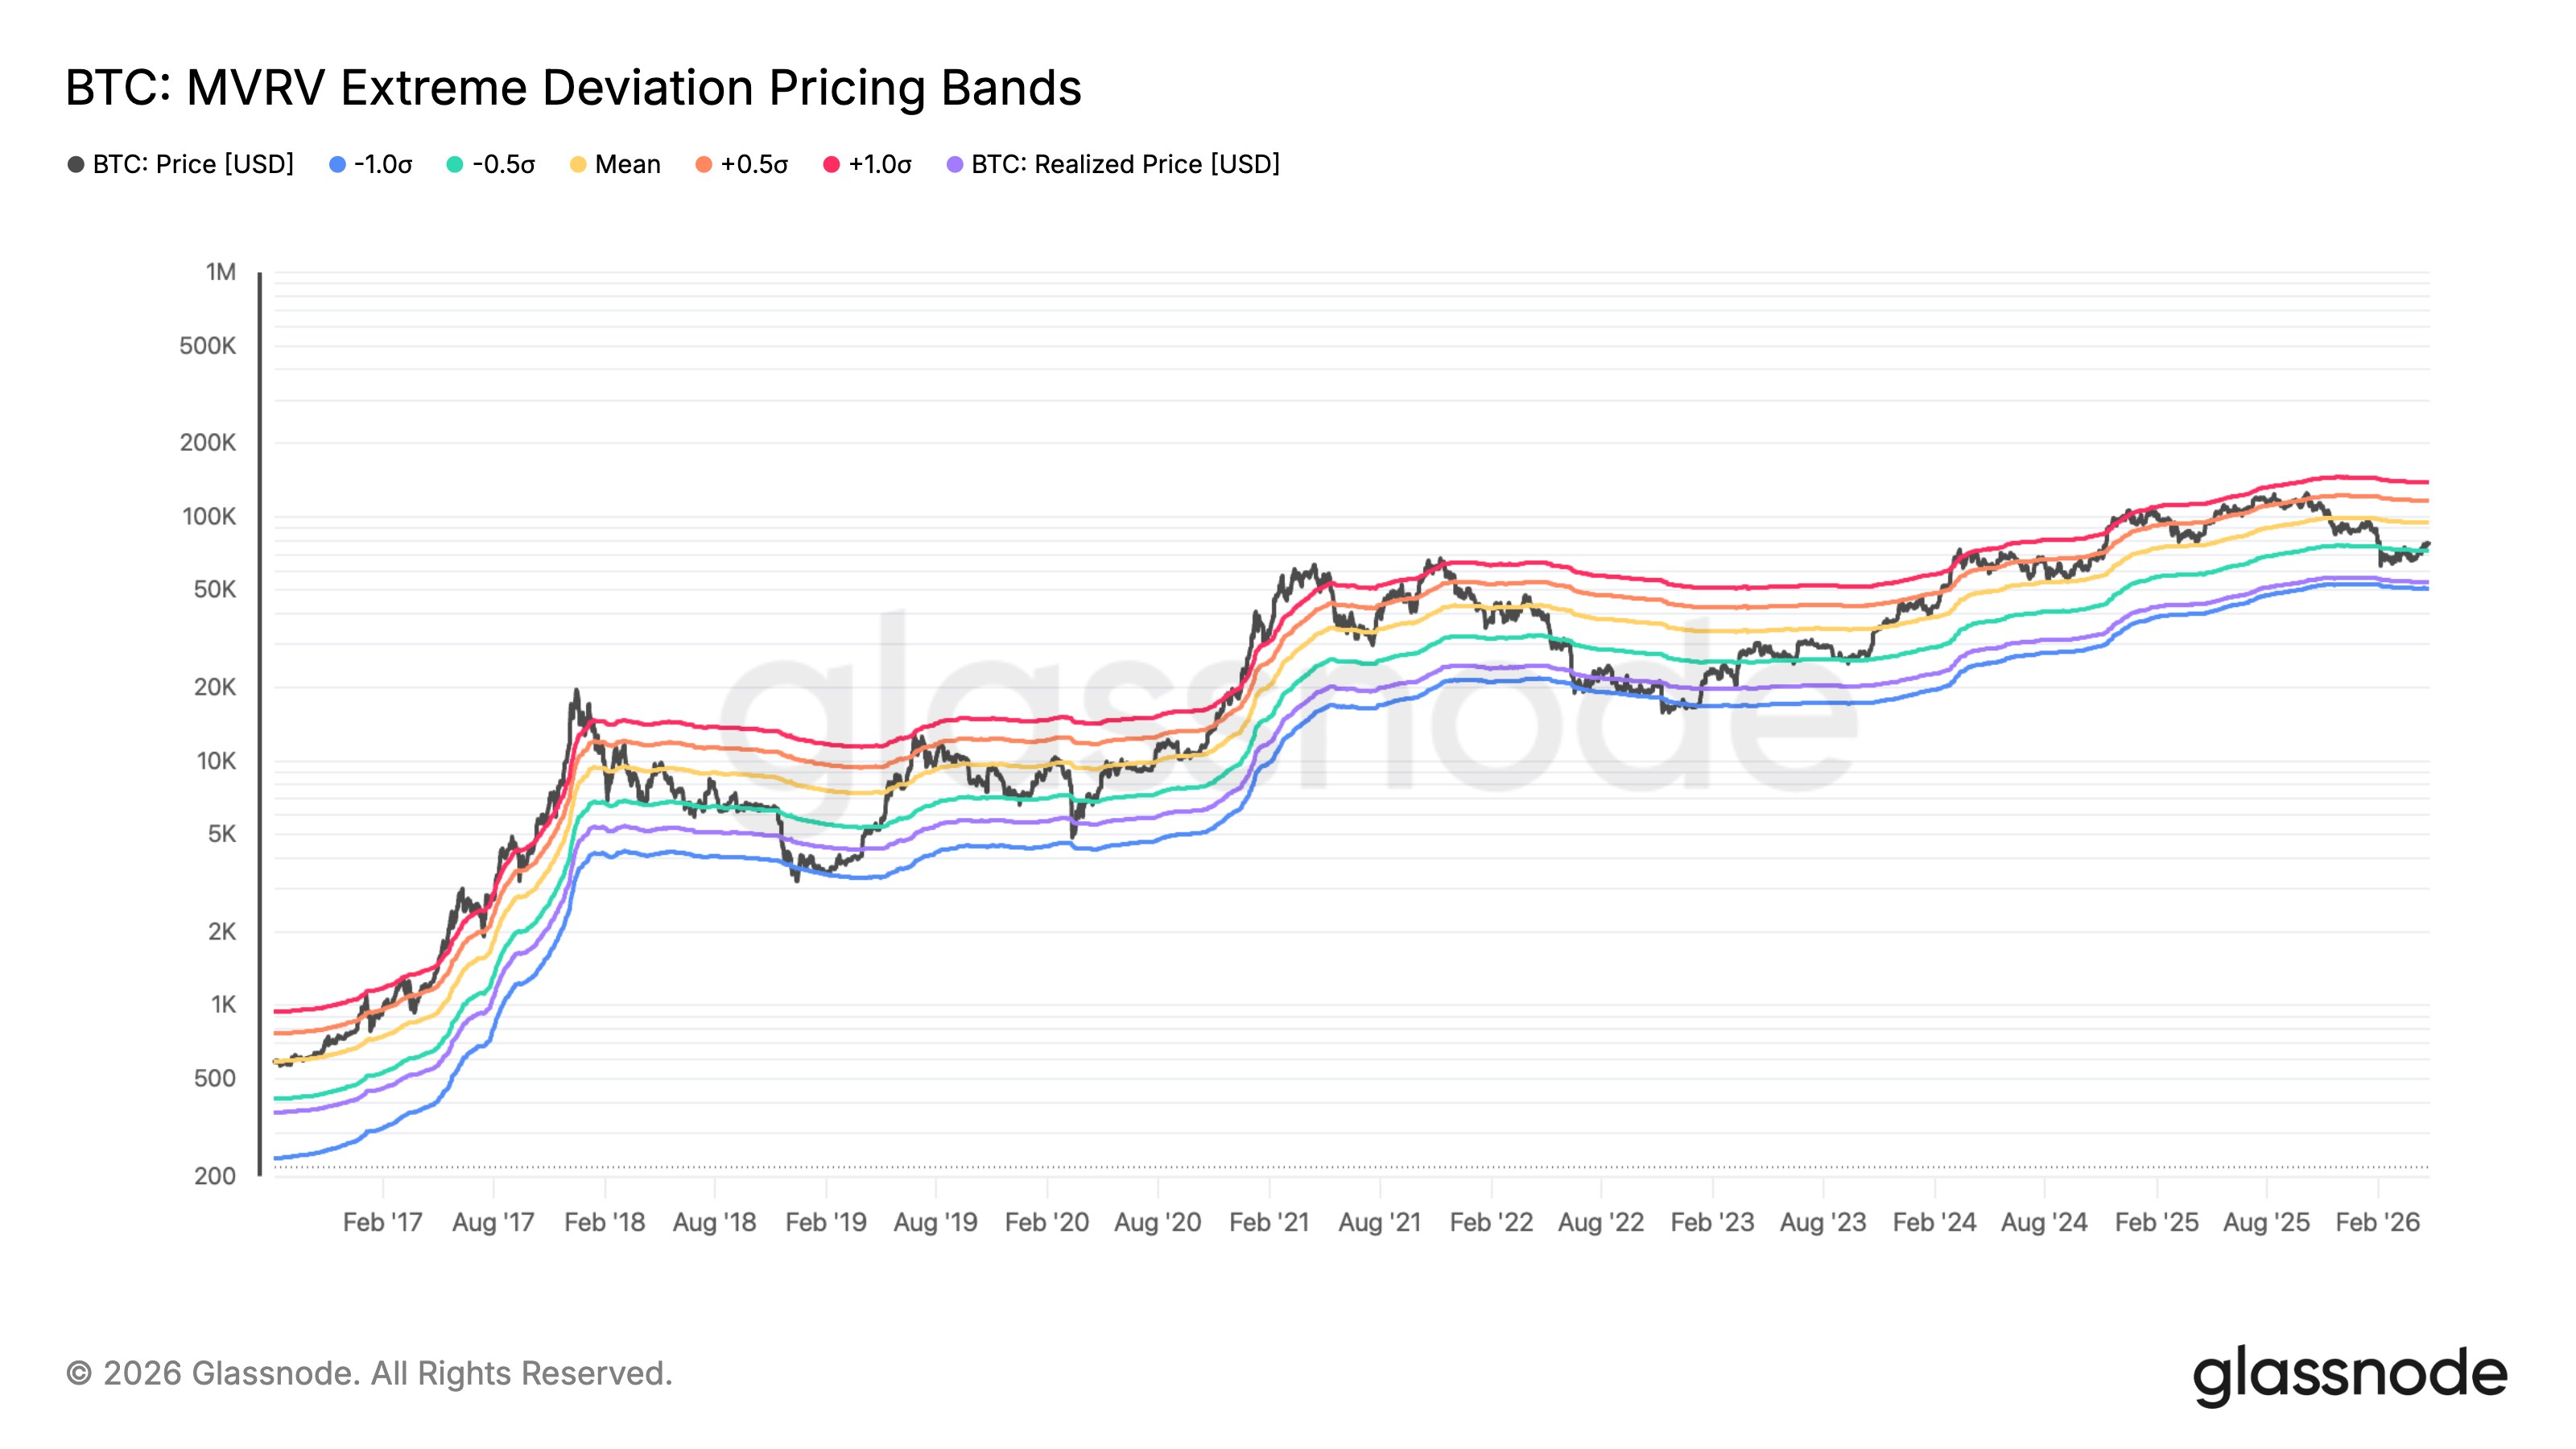
BTC MVRV Extreme Deviation Price Bands vs. Price. source: glass node
Once BTC moves back above the lower deviation band, the market is no longer trading at a significant discount to realized value, often opening room for a move to the next band.
As shown below, a similar recovery of the green band as support during past downturns, including the 2014 and 2018 bear markets, was followed by a short-term rally towards the average band (yellow).
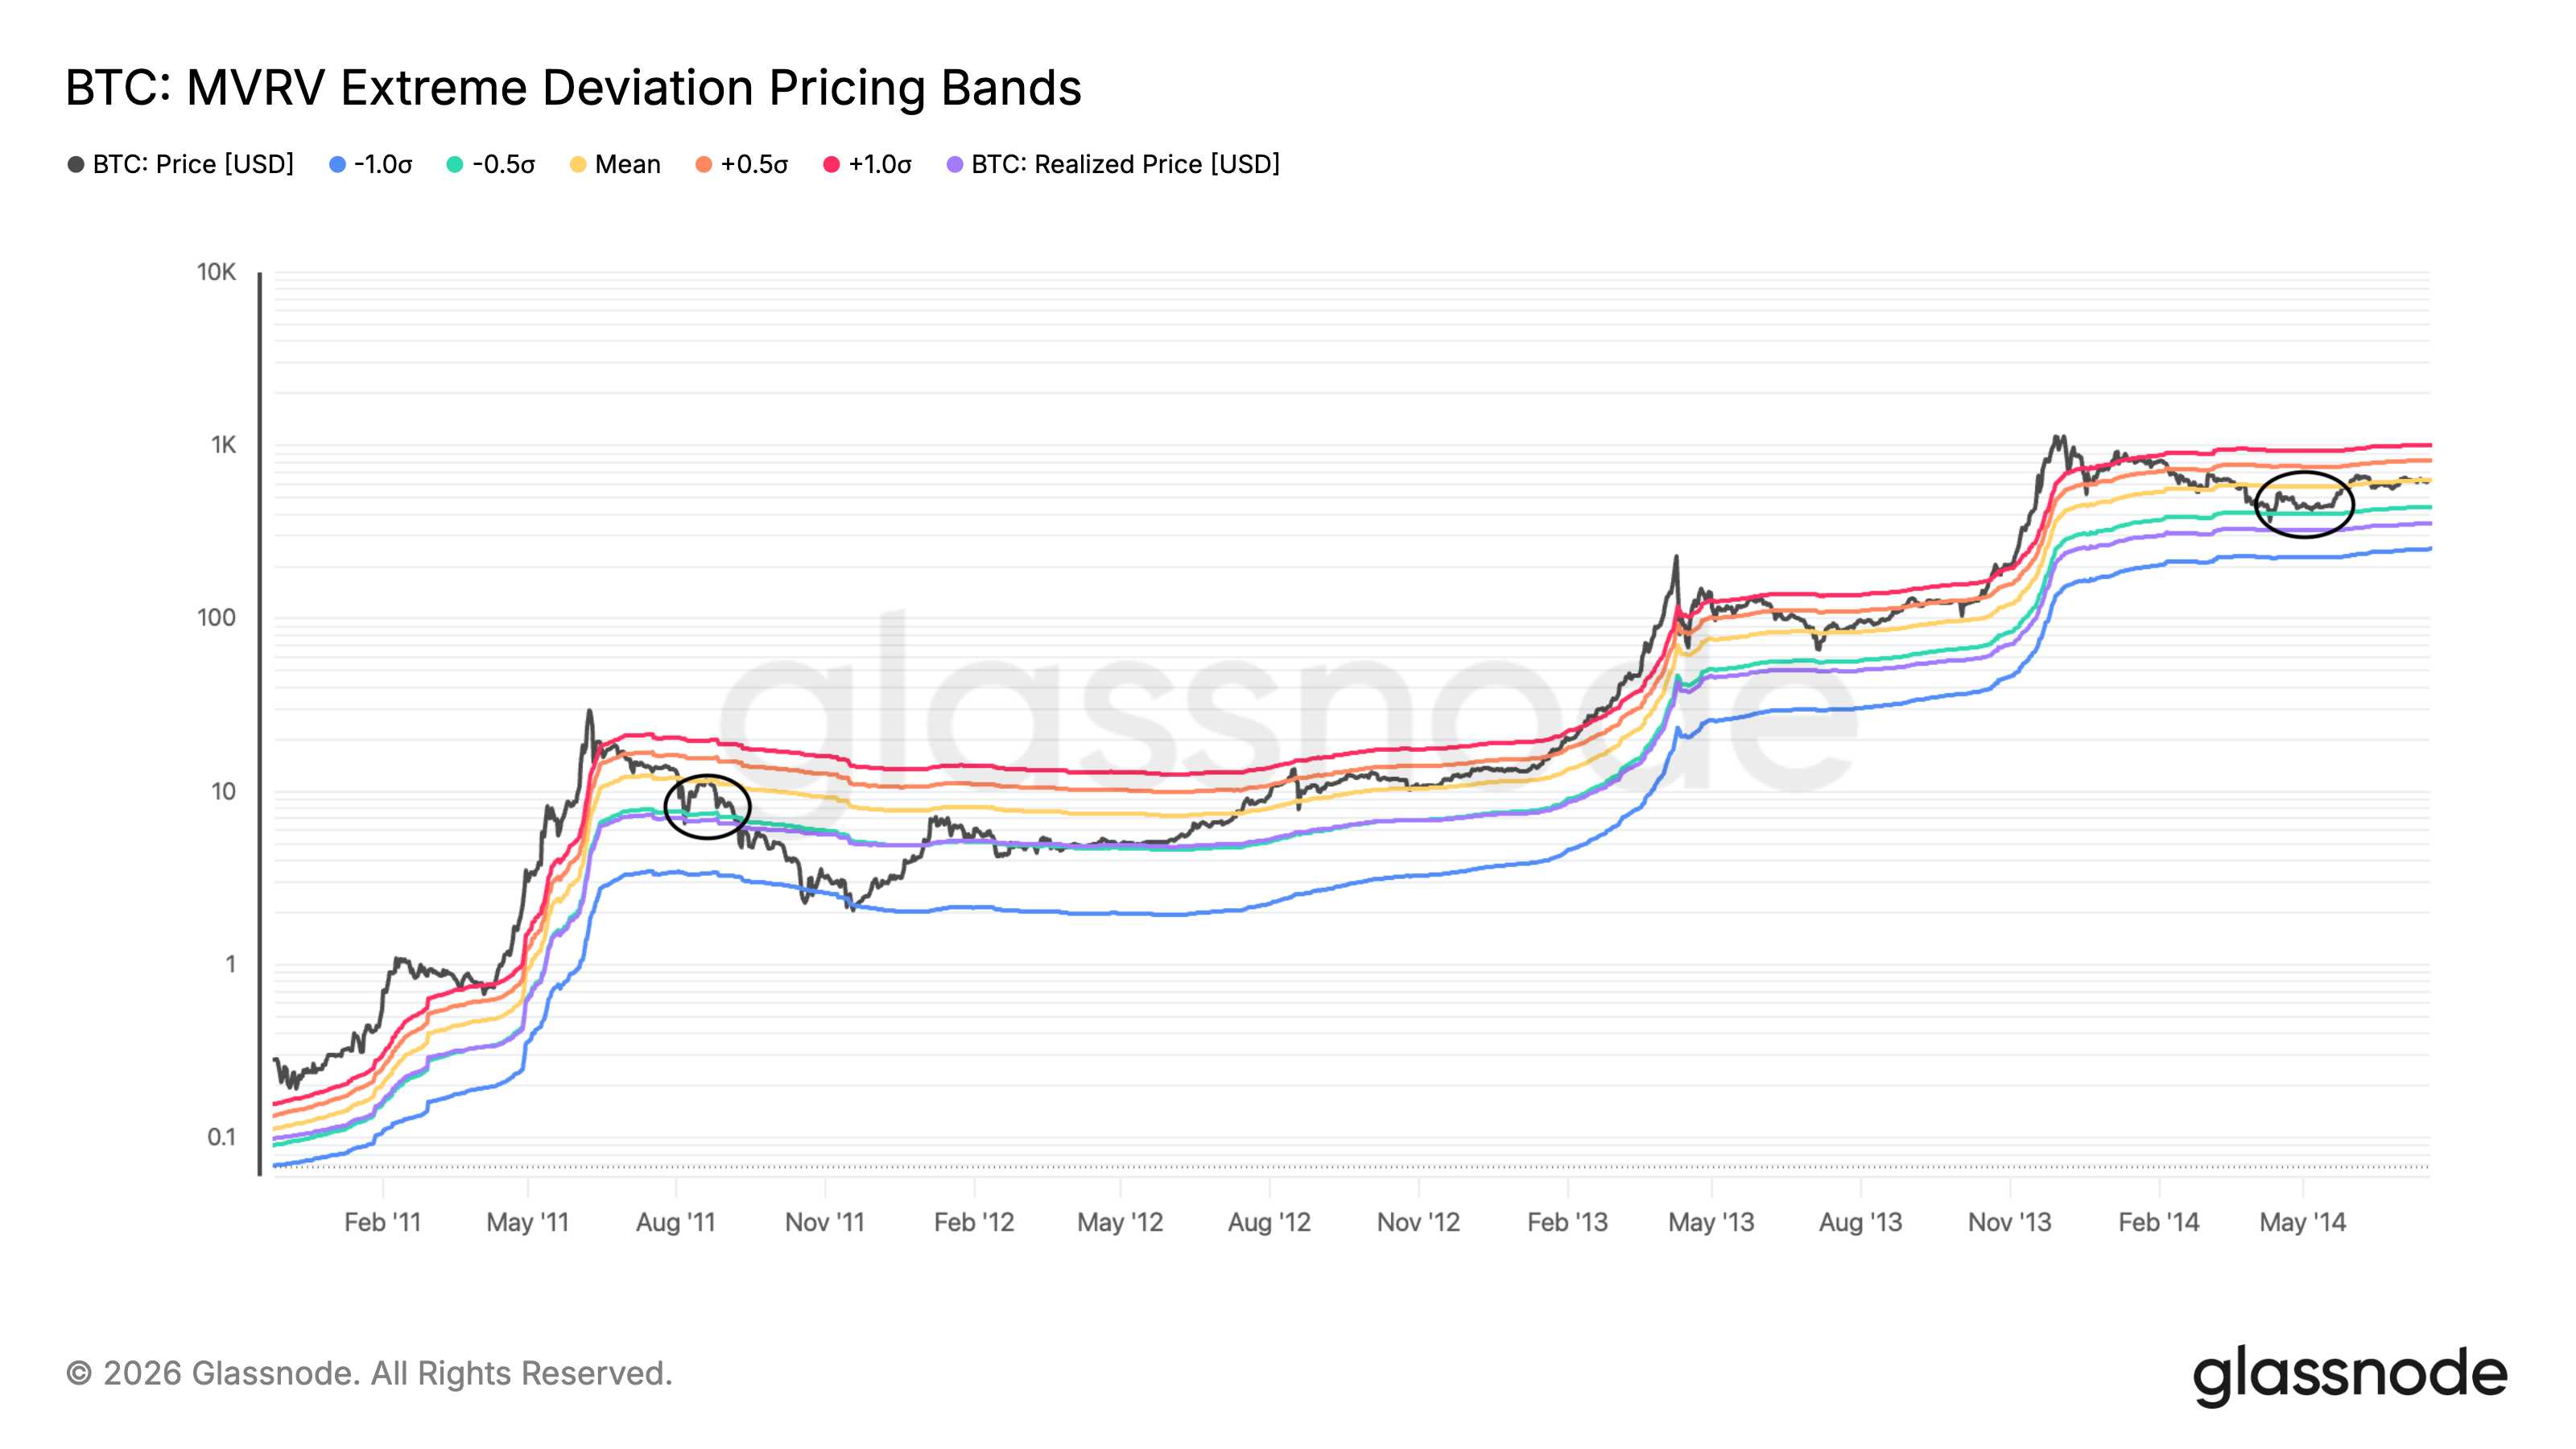
BTC MVRV Extreme Deviation Price Bands vs. Price. Source: Glassnode
If history repeats itself, Bitcoin’s next potential upside target would be near $94,500.
This signal does not confirm a new bull market, but strengthens the case for a bear market relief rally. On-chain analyst Willy Woo said Bitcoin is still bottoming, with the $65,000 level acting as a key bottom.
A decisive break above investors’ recent cost basis of $79,000 is needed to strengthen the recovery, and the next six weeks will determine whether this move can develop into a sustained trend reversal, Woo said.
BTC’s next test will be to completely break the cost basis of recent investors (79,000).
There is a 30% chance of doing this on this attempt.