Market Outlook #249 (11th December 2023)
Hello, and welcome to the 249th instalment of my Market Outlook.
In this week’s post, I will be covering Bitcoin, Ethereum, Polygon, Uniswap, Optimism, Alchemix, Altered State Machine and Raini.
As ever, if you have any requests for next week, send them across.
Bitcoin:
Weekly:
Daily:
Price:
Market Cap:
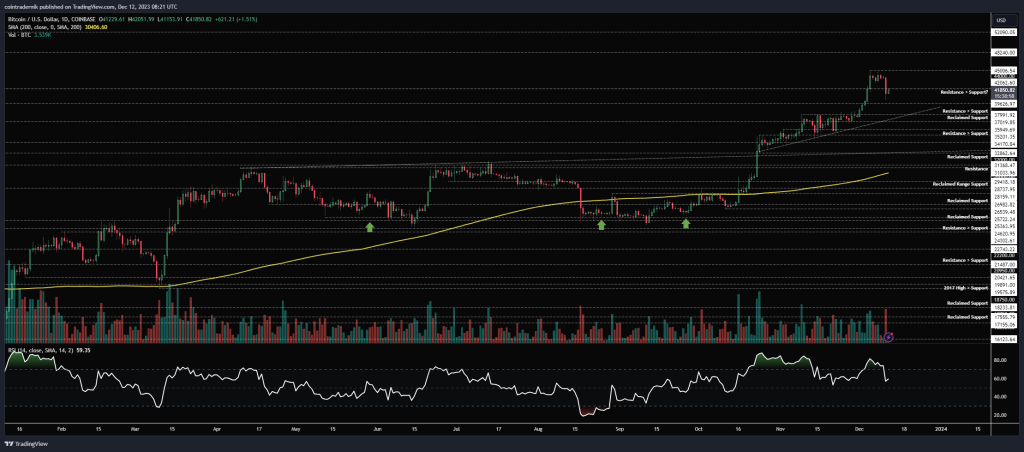
Thoughts: If we begin by looking at BTC/USD, on the weekly timeframe we can see that last week closed at fresh yearly highs, through $42k resistance on growing volume. Price closed out the week just shy of $44k and early trading this week has seen price dump back below $42k but hold above $39.7k as support, pushing up from that area back towards $42k, where it is currently sat. Looking at this, there is very little to suggest any slowdown, particularly after last week’s close through that confluence of resistance. Whilst we continue to hold above $39.7k this week, I think we see this consolidation around $42k lead to further expansion next week into the 61.8% retracement level and prior resistance at $48k, where it is likely we start to form a local top. If, however, this sell-off continues later this week and we close the week back below $39.7k, it’s likely the local top has formed here and we can look for further downside next week into $36k to retest all that prior resistance as support; below that level, we clear out all the untapped lows into $33k. That’s the roadmap from both perspectives going into 2024.
Turning to the daily, we can see that price sold off sharply yesterday in something of a mini liquidation cascade, taking it from up near $44k down into $40k, before bouncing and now consolidating right below that $42k level. At present, $42k is daily resistance, so reclaiming that over the next day or two would suggest a further recovery of that cascade and likely a march to fresh highs from there; if, however, $42k continues to act as resistance this week, we may have further to fall yet before finding a bottom, with $39.6k yet untested – a second leg lower into that level followed by a $42k reclaim would be a nice bottom formation to look for longs. As mentioned above, until we close the higher timeframes below $39.6k, I don’t think this uptrend is done quite yet. And above $45k there is only air into $48k.
Ethereum:
ETH/USD
Weekly:

Daily:

ETH/BTC
Weekly:

Daily:
Price:
Market Cap:
Thoughts: Beginning with ETH/USD, we can see that price closed firmly through resistance at $2170 last week, pushing as high as $2400 before closing at $2350 on good volume. We were inches shy of that $2425 level but price has rejected that resistance early this week, clearing out the prior weekly low into prior resistance turned support at $2170 and bouncing off it. If we can now hold above that level, that looks very much like a little flush before expansion beyond the 38.2% fib and reclaimed resistance at $2426, with $2650 the next level of interest above that. If we close the weekly back below $2170, I would expect $1850 to be retested before a bottom is found, where there is plenty of confluence. Turning to the daily, we can see how the pair wicked right into that prior resistance cluster before bouncing hard yesterday, so holding above $2137 over the next day or two is paramount for this structure to remain valid as resistance turned support; start closing back inside those resistances and the picture looks less pretty, with a load of untapped lows visible before that $1850 level comes into view, where the 200dMA is also sat…
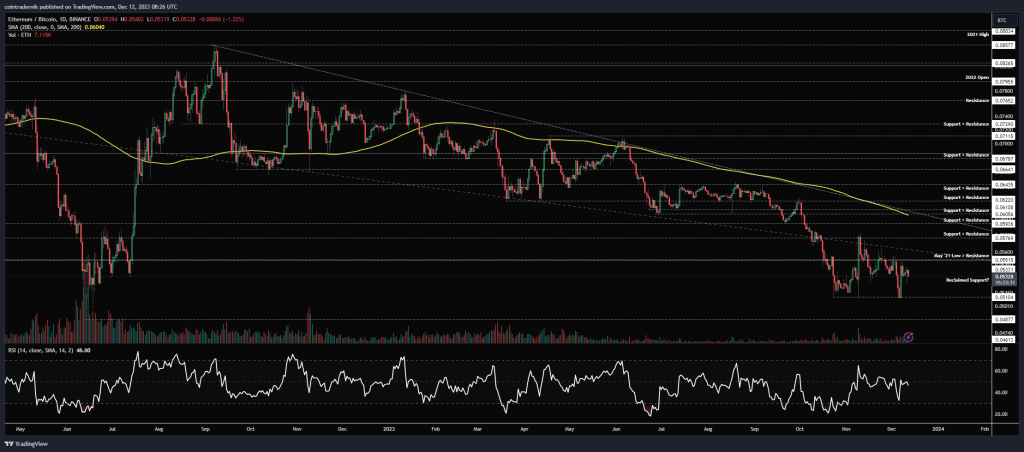
Looking now at ETH/BTC, last week retested 0.051 as support and held once again, bouncing off that to close at 0.0537, but remaining firmly capped by 0.0551 as resistance. As mentioned last week, the picture is very clear here: below 0.051 we take out 0.04877 before finding a bottom; and above 0.0551 and the 200wMA we trend towards trendline resistance. No need to make it any more complicated than that. A longer-term reversal only becomes high probability once we turn that multi-year trendline into support, in my opinion.
Polygon:
MATIC/USD
Weekly:

Daily:

MATIC/BTC
Weekly:

Daily:
Price:
Market Cap:
Thoughts: Beginning with MATIC/USD, we can see on the weekly that price bounced off that 200wMA last week and rallied back into support turned resistance at $0.92, closing right at that confluence of resistance. Early this week, the pair has sold off, holding above the 200wMA and now sat in no man’s land within the prior weekly range. Until we get a weekly close above $0.93, we can’t be certain of further expansion / trend continuation, but given the structure here and the reaction off the 200wMA I am leaning towards a breakout soon. If we drop into the daily, we can see that price also held above the 200dMA, front-running it as support before reversing. As long as we now form a higher-low above $0.77, I would expect the next crack at $0.93 to give way and for the pair to then expand towards $1.30 in the coming weeks.
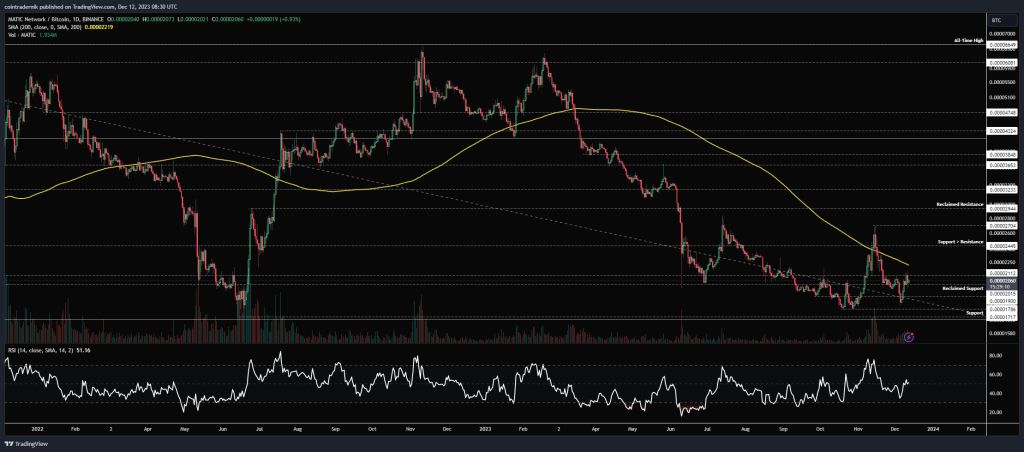
Turning to MATIC/BTC, we can see that price rallied off of support last week, wicking towards 1717 satoshis before closing the week at highs around 2100. This is a promising sign for bulls, and if we can now hold above 2000 I would expect the range to get filled in towards the 200wMA and prior support turned resistance at 2450. Dropping into the daily, we can see how price faked out above the 200dMA before retracing into that support cluster and now turning daily structure bullish on the most recent bounce. Acceptance above 2100 on the daily here is key, as that would make it very likely we break beyond the 200dMA again, and usually the second breakout from a bottoming formation is not a fakeout, so we could expect to see 2450 satoshis followed by 2950.
Uniswap:
UNI/USD
Weekly:

Daily:
UNI/BTC
Weekly:

Daily:

Price:
Market Cap:
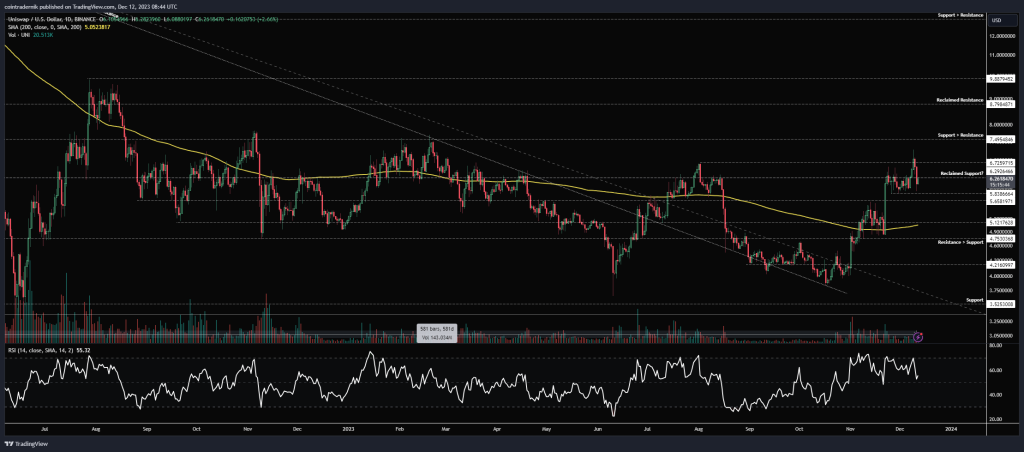
Thoughts: Beginning with UNI/USD, we can see on the weekly that price poked above $6.30 last week, pushing towards $7.50 before closing back near $6.60. We definitely have bullish structure here but UNI remains within a 580-day range, having spent much of 2023 chopping around above range support and below $7.50. From here, I would like to see this area around $6.30 hold as support and price to close the weekly through $7.50 later in December; that for me is the beginning of the next cycle for UNI, given how that level has capped the pair since September 2022. Above it, I think we take out the $9.90 high and continue into the 23.6% fib retracement of the bear market at $13.87 before finding any meaningful resistance. Looking at the daily, on this timeframe it’s key we hold above $5.65 as reclaimed support; a nice wick below $5.84 into that level followed by a reclaim of $6.30 later in the week would be a really nice signal for further upside, in my view.
Turning to UNI/BTC, we can see that price is now consolidating above multi-year support at 14k satoshis after deviating below it. Whilst this level continues to hold as reclaimed support, I think it looks very much like the bottom has formed here and we can expect a move through 17.5k satoshis to come sooner rather than later; above that, weekly structure turns bullish and I would be expecting outperformance for UNI all the way back towards that 26.7k satoshis area. Dropping into the daily we can see how the 200dMA continues to cap the rallies recently, so a move through 17.5k would also turn that into support, providing confluence for further upside.
Optimism:
OP/USD
Daily:
OP/BTC
Daily:
Price:
Market Cap:
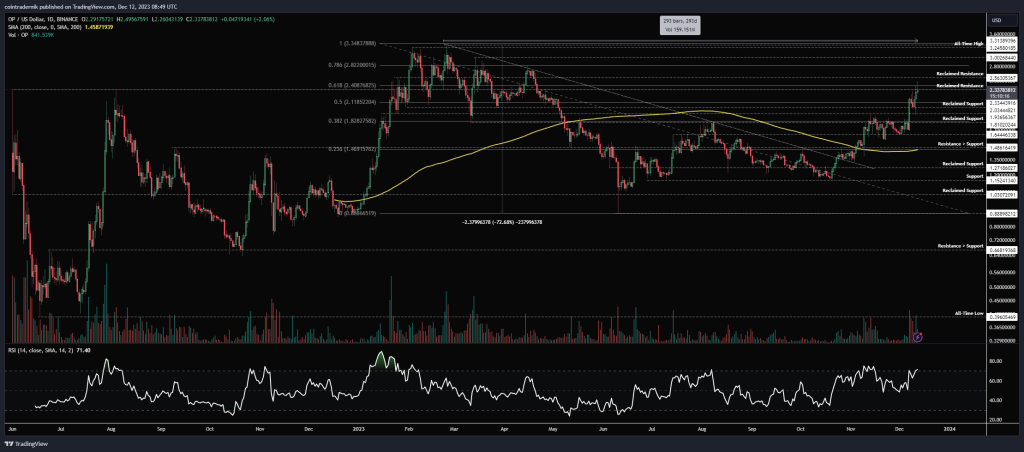
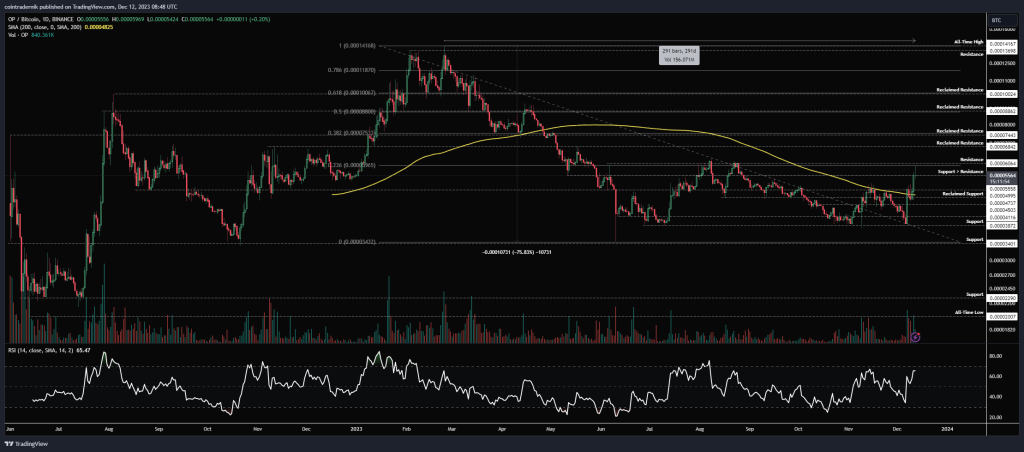
Thoughts: As Optimism has only been trading for around 18 months I will focus here on the Dollar pair.
Looking at OP/USD, we can see that price is very much in an uptrend, having marked out a bottom in June and a macro higher-low in October, then breaking through trendline resistance from the all-time high, flipping the 200dMA as support and continuing to rip higher. Last week saw the pair push through the $2 area as resistance into reclaimed resistance right around $2.40, below which it currently sits. This is arguably the most important resistance on the chart at present, with it being both the 61.8% fib retracement of the bear market and the double top from 2022. Accept above this level as reclaimed support and I think we get a parabolic move towards all-time highs from there, with a high probability that this second bull cycle takes OP into price discovery beyond $3.30 given the market conditions.
Alchemix:
ALCX/USD
Daily:

ALCX/BTC
Daily:

Price:
Market Cap:
Thoughts: As both pairs look identical here for ALCX, let’s focus on the Dollar pair.
Looking at ALCX/USD, we can see that price had formed a long-term bottom at $16.42, before breaching it to form a double bottom at $13.46 in 2023. Subsequently, in August 2023, we deviated below that double bottom, formed a fresh all-time low at $10.27 and then consolidated for a few months between that low and prior support turned resistance, also finding resistance at the 200dMA, above which the pair had not found support (beyond a brief fakeout) for several years. Price has since emerged from this range, reclaiming both $13.46 and $16.42 as support, turning daily structure bullish. Simultaneously, we have turned the 200dMA into support, above which a higher-low has formed. Price rallied from that low into $26.44 last week before rejecting and now retracing back into prior resistance at $18.70. As long as the pair can continue to hold above $16.42 here, I would expect to see continuation higher, as this is very much a classical cyclical bottom at present and any move above $26 will likely be the beginning of the next bull cycle for ALCX. For targets on spot bags, $73 would be the first area of interest after the gap fill, followed by $178 and then $478 as major resistance.
Altered State Machine:
ASTO/USD
Daily:
ASTO/BTC
Daily:

Price:
Market Cap:
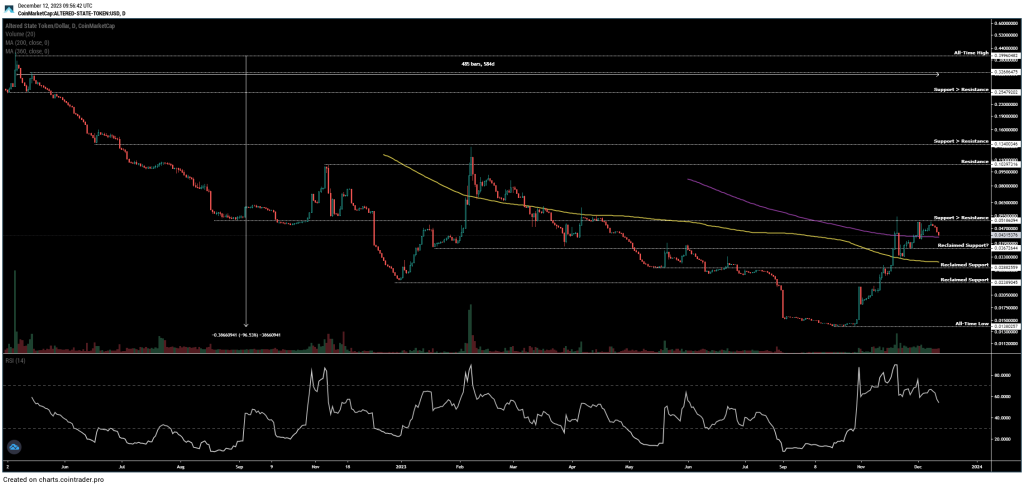
Thoughts: Again, as ASTO has only been trading for around 18 months, let’s focus here on the Dollar pair.
Looking at ASTO/USD, we can see that price has concluded its first bear cycle, losing 97% of its value from the all-time highs at $0.40. Price bottom in October at $0.014 before beginning a sharp rally since, reclaiming multiple levels of support and closing firmly above the 200dMA, which acted as support in November. Price is now sandwiched between support turned resistance at $0.052 and reclaimed support at $0.037, sitting marginally above the 360dMA at present. As long as the $0.037 area holds as support, I think the structure here is fine despite the divergence in momentum; close below that and we likely retraced back towards $0.029 to find support again, with $0.024 as the golden opportunity for a spot entry if that comes. If this structure does hold and price simply consolidates within this range, I would look to buy spot on acceptance above $0.052, as there is basically no resistance above that for another 100% rally, and no resistance beyond $0.13 all the way into $0.25. I think when this one rips, it’ll really rip, with fresh highs beyond $0.40 likely in 2024.
RAINI:
RAINI/USD
Weekly:

Daily:

RAINI/BTC
Weekly:

Daily:

Price:
Market Cap:
Thoughts: Beginning with RAINI/USD, we can see that price closed last week at fresh yearly highs for 2023, marginally through resistance at $0.05. We have since continued to push higher early this week with $0.05 acting as support. If that level can continue to act as support this week, there is no real resistance on the weekly timeframe back into the 38.2% fib of the bear market and reclaimed resistance at $0.08-$0.088. That would be where I would expect a local top to begin to form, from which we may get the first major correction for Raini of this new cycle. If, however, we deviate above $0.05 this week and then close back below it, it’s likely the local top is in here and I would look for a higher-low to form above $0.035 before continuation into that range above. Ultimately, this is one I am looking to hold for many more months yet, with expectations of fresh all-time highs beyond $0.20 in 2024, particularly given the Beam narrative.
Turning to RAINI/BTC, we can see that price is currently sat right around that 38.2% fib but there isn’t an historical level here for confluence. I would expect 156 satoshis to be retested as resistance if we can hold above 121 here. Beyond that level, fresh yearly highs are on the way through 183, with 230 satoshis the level to watch for beyond that. Again, if you’re in a spot position like me, I’m now sitting on my hands until we hit 280 satoshis as major resistance, selling a partial and then letting the rest ride for fresh all-time highs.
And that concludes this week’s Market Outlook.
I hope you’ve found value in the read and thank you for supporting my work!
As ever, feel free to leave any comments or questions below, or email me directly at nik@altcointradershandbook.com.

